Via the excellent Damien Boey at Credit Suisse:
- Real yield curve model points to steepening, but … We define the Australian real yield curve as the 10-year inflation-indexed bond yield minus the real 3-month interbank rate, using the inflation swaps curve to profile long- and short-term inflation expectations. Our proprietary model of the real yield curve is based on 4 factors – the spread between NAB business confidence and conditions indices, Westpac home-buying sentiment, prospective widening of the US trade deficit (a proxy for the marginal supply of USD liquidity to the world) and finally, the implied spread between short- and long-term neutral rates from our RBA “Taylor” rule derived from our “real-time” output gap proxy. The model gives us a powerful leading signal as to where the real yield curve is likely to move in the period ahead. And right now, it points to steepening. Whereas the real yield curve is currently inverted to the tune of -64bps, the model points to a slope of +6 bps. Our anticipated delta in the curve is significant. But the end point is not, barely indistinguishable from a flat curve, with potential downside risks at the zero lower bound on rates.
- Bounce back in business and housing sentiment helps, but trade war escalation is a growing concern. Recently, we have seen business confidence recover to less negative levels, while home-buying sentiment has risen very sharply. However, in our curve model, these factors have been offset largely by adverse developments in the drivers of the US trade deficit. Our US “core” trade balance model is based on US household and government saving, as well as the trade-weighted exchange rate. Prospective movements in the US trade deficit drive global liquidity and growth expectations, therefore influencing the slope of the real yield curve. Lower (higher) domestic saving and a stronger (weaker) real exchange rate have historically led to wider (narrower) trade deficits and more (less) USD supply to the world via trade. Reflecting a sharp increase in US household saving and de-leveraging pressures therein, our US trade balance model has started to project shrinkage in the trade deficit, consistent with the US economy exporting less USDs abroad and the rest of the world experiencing a material funding squeeze – and all of this before we have even seen the effects of US-China trade war re-escalation.
- Worried about the zero bound on rates. The output gap is the other key driver of our real yield curve model. A wider gap is consistent with short rates being set further below the neutral rate, and a theoretically steeper yield curve. We proxy the output gap in real-time using NAB survey capacity utilization and male full-time equivalent employment as a share of the “active” labour force. At the time of writing, we have only received one of these components for April – NAB survey capacity utilization – and it has plunged to (new) historically low levels. We have not yet obtained April labour market data. But we have assumed the Consensus forecast for a 3% monthly increase in the unemployment rate, and incorporated this into our real-time output gap measure. Our best guess is that the output gap has increased to roughly 7% of GDP, consistent with an equilibrium RBA cash rate below -5%. If this were possible, the “Taylor” rule component of our yield curve model would be contributing to a steeper real yield curve. But it is not possible. Therefore we have become concerned that our real yield curve model could be overstating the case for steepening. Effectively, at the zero lower bound, we may have exhausted the pool of credit worthy borrowers, making it very hard for the banking system to recover in response to monetary stimulus, therefore precluding steepening of the curve.
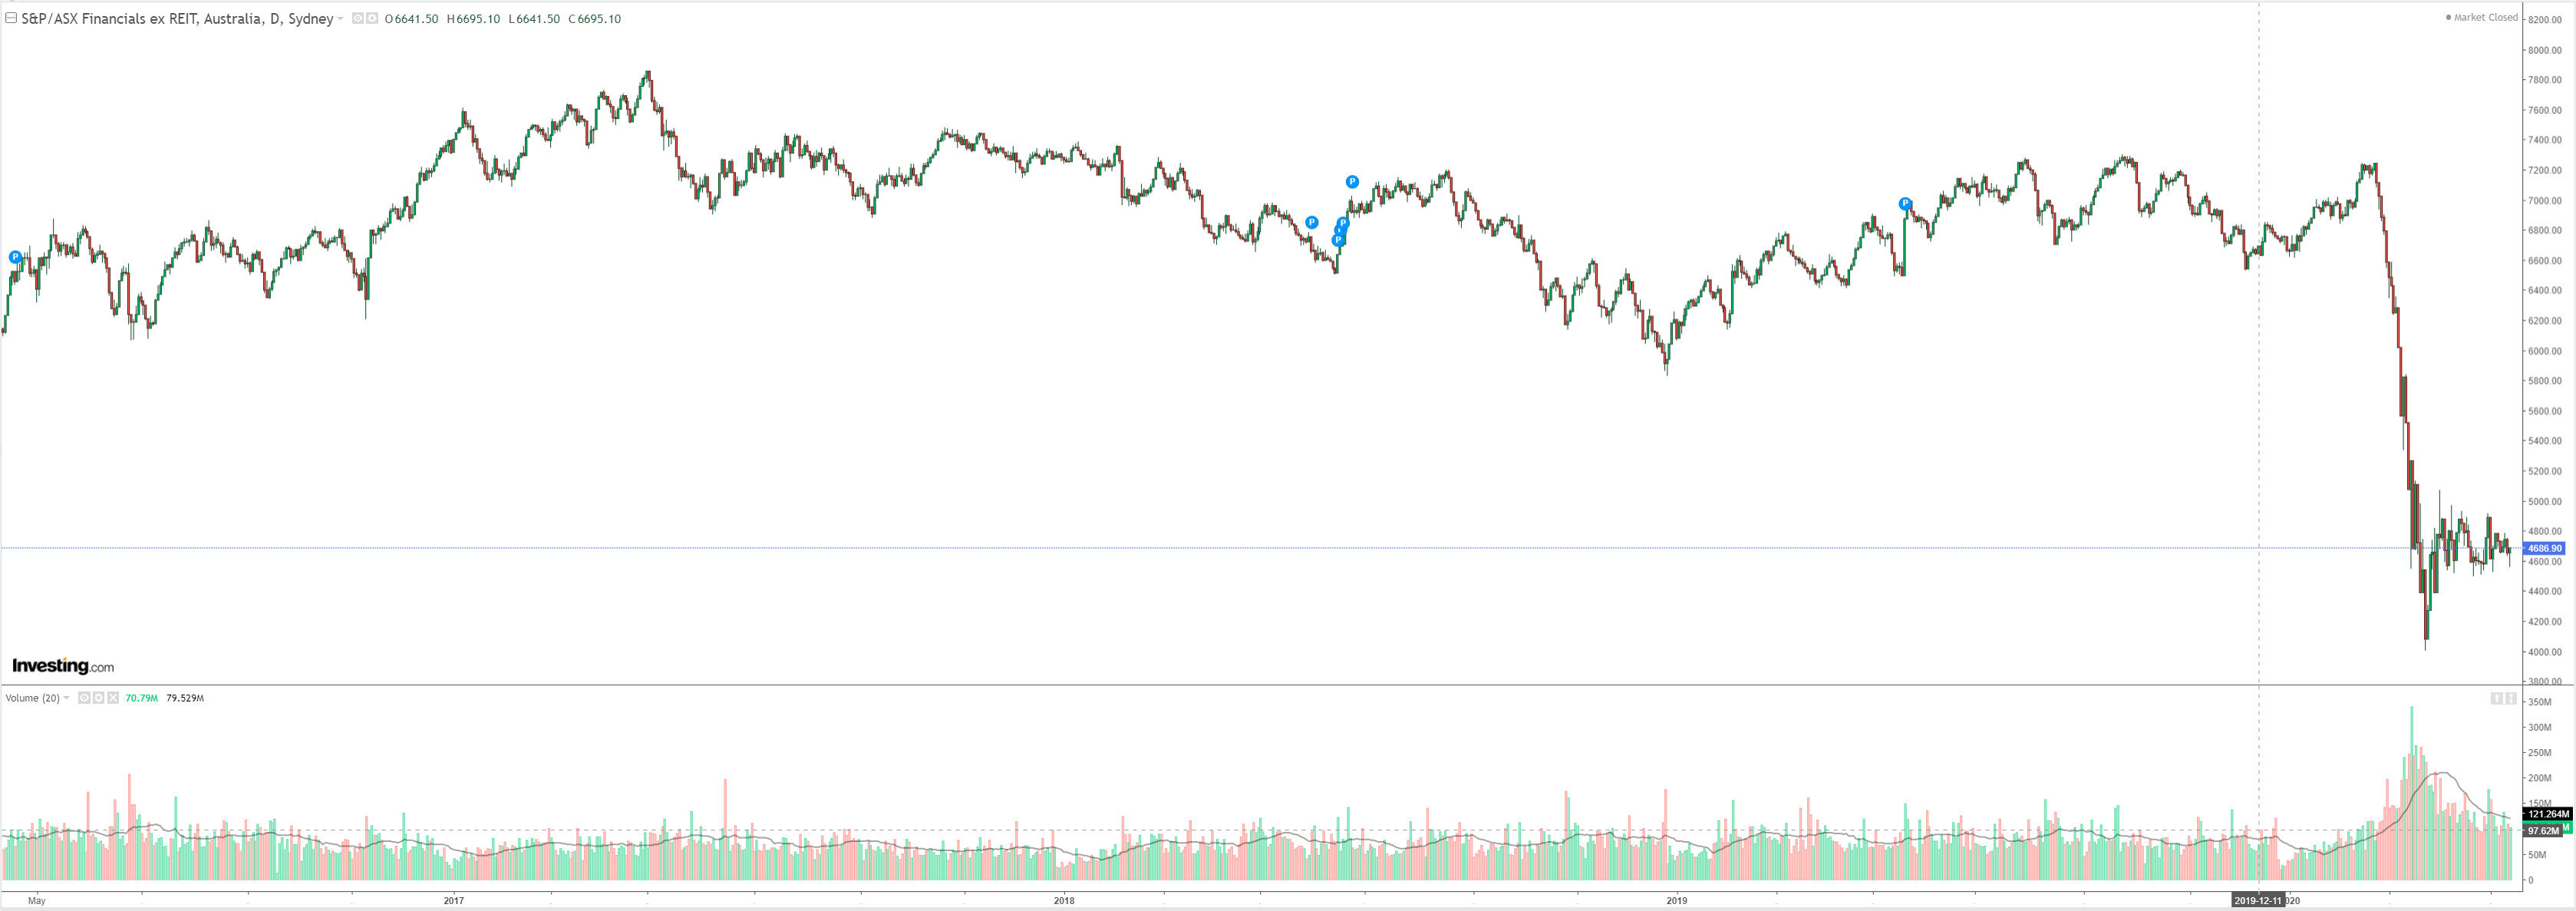
- Value head fake? Historically, real yield curve steepening is positive for value investing within the equity market. However, our concern is that even if the curve steepens, it might not do so to very positive levels. Indeed, if the RBA is in a liquidity trap, the real yield curve may not escape inversion at all. And this matters, because the real yield curve is a powerful leading indicator of bank earnings growth, and banks are part and parcel of the Australian value bucket.
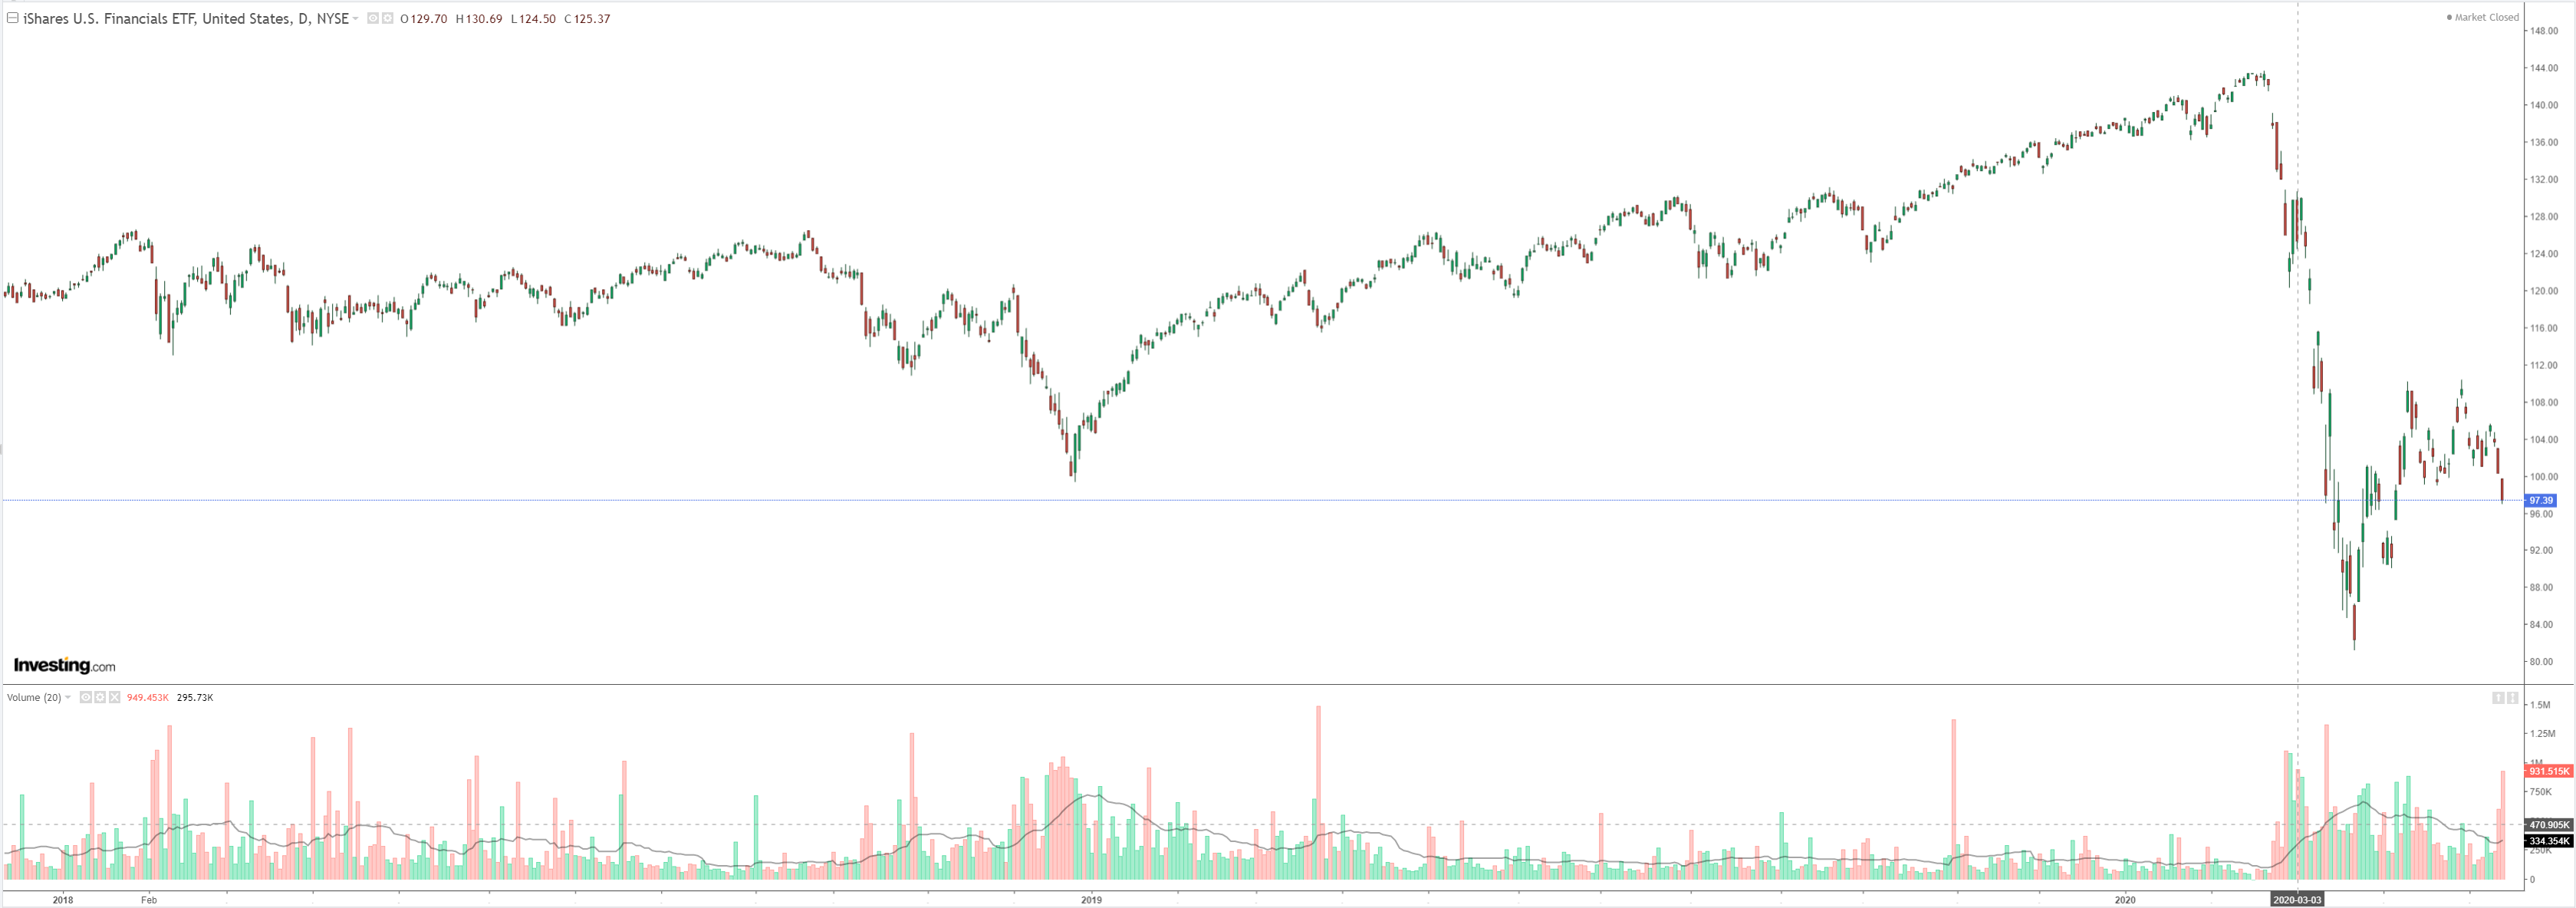
In short, avoid banks like the plague, and even today’s stock bubble is: