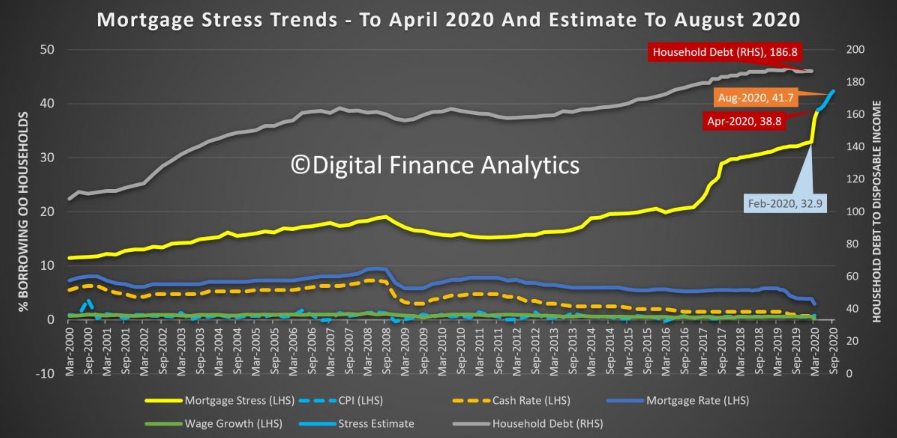
The latest DFA mortgage stress data, derived from our rolling household surveys reveals than an additional 100,000 households joined the cash-flow stressed in April, bringing the percentage of households to more than 38%, which equates to more than 1.4 million.
The trajectory is still set to reach more than 41% by August. Our estimates take account of the enhanced JobSeeker, JobKeeper and Bank mortgage repayment holidays. Given the ABS reported around 650-700,000 employed people have lost work since mid-March, we expected these increases to track close to our estimates.
A reminder, we define mortgage stress in cash flow terms, rather than a set proportion of income. One other factor in play is that many households relied on multiple incomes and the loss of just one is sufficient often to push people into stress. Defaults are likely to follow, but not immediately, as people draw on savings, put more on credit, or simple hunker down for a time.
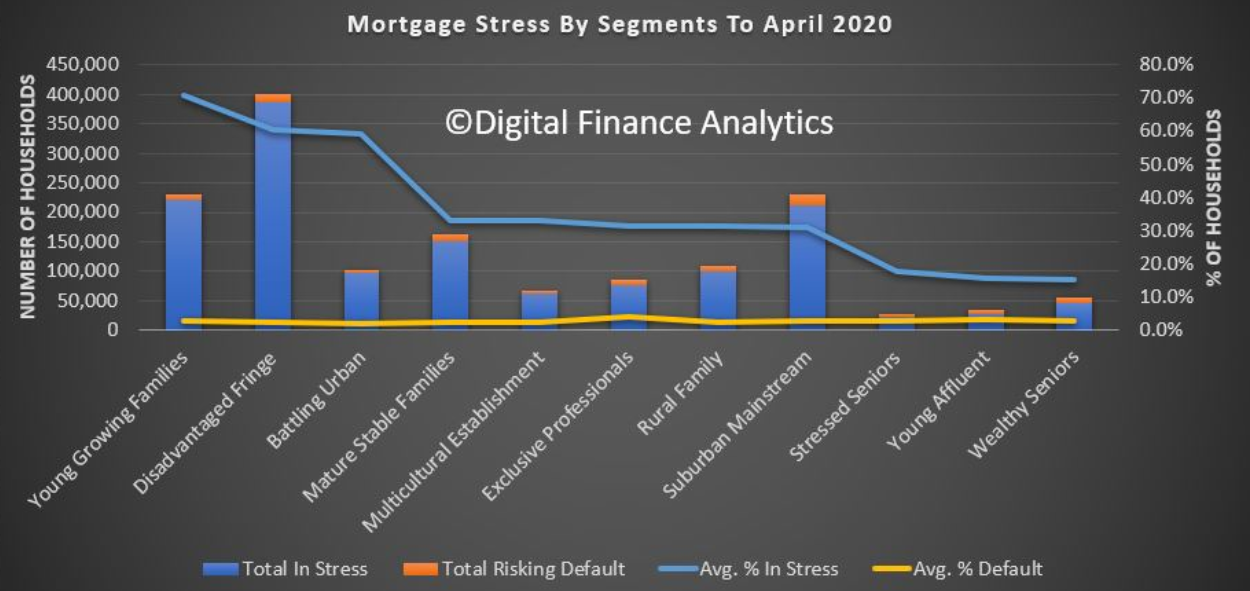
Across our segments, young growing families, at more than 70%, are at risk, follower by those battling on the urban fringe. But we continue to see a growth in more affluent households also being hit.
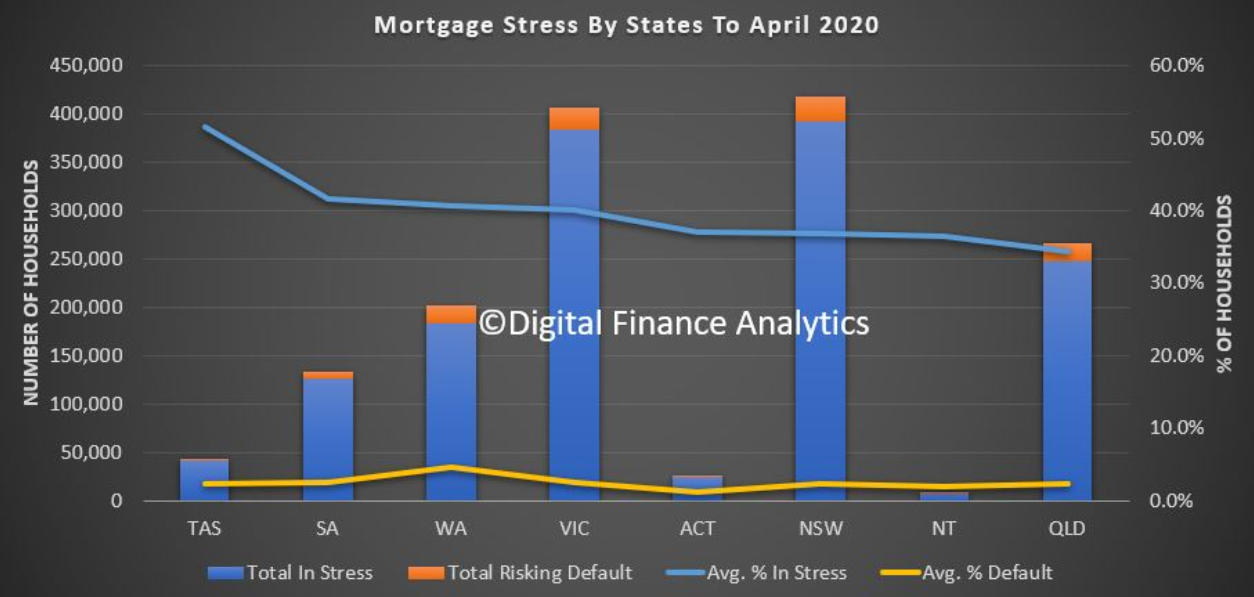
Across the states, Tasmania contains the highest levels of mortgage stress, thanks to the over-reliance on tourism and recent price rises relative to income. Some lenders have become more cautious here, with many investors unable to secure a mortgage repayment holiday.
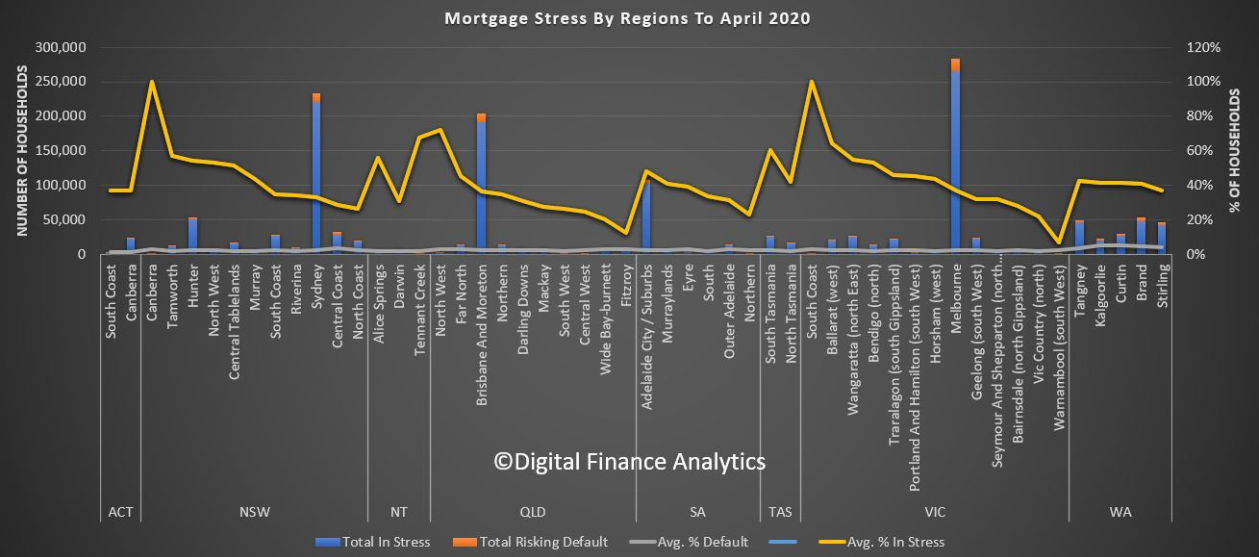
Across the regions we see pockets rising in regional areas, as well as the main urban centres. Mortgage stress is not just a big-city disease.
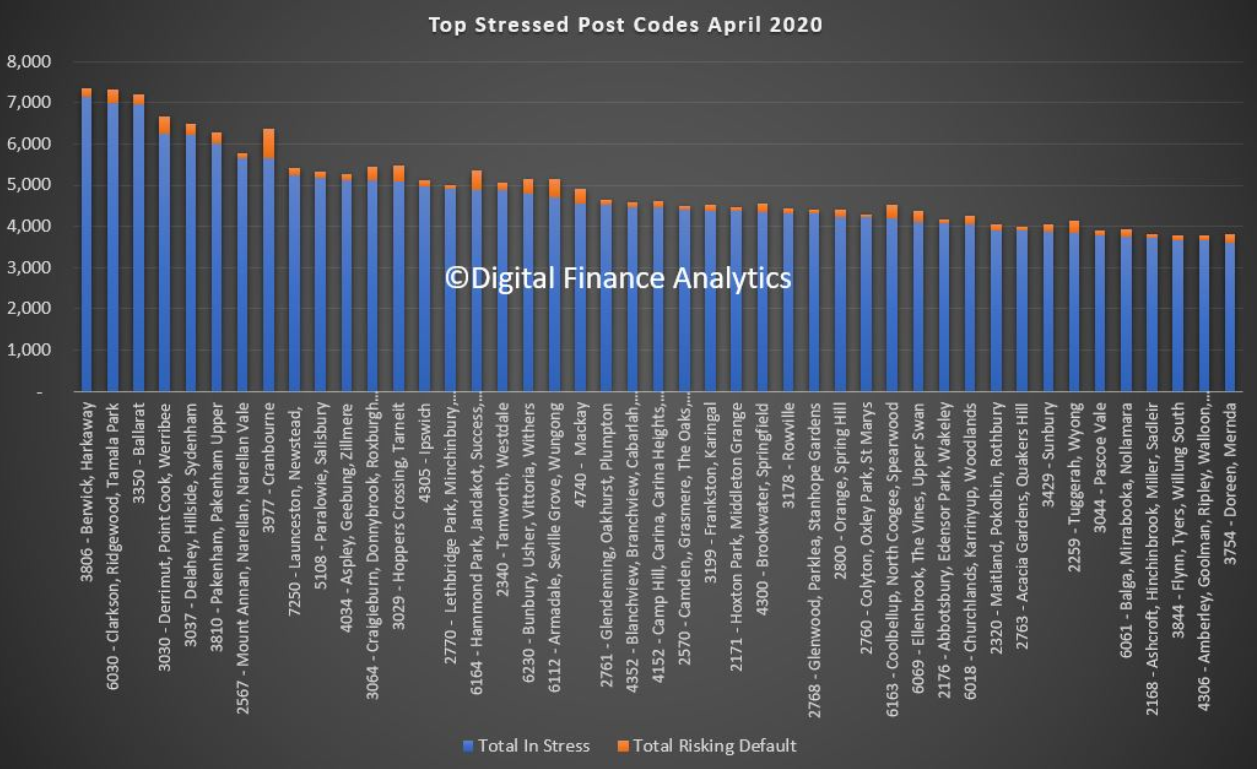
By postcode, Melbourne post code 3806, Berwick and Harkaway now leads the way with more than 7,000 households in the district under pressure. VIC figures strongly with the top 5, with 3350 Ballarat, 3030 Werribee and 3037 Sydenham all impacted. Second though behind 3806 is WA code 6030 which includes Clarkson and Tamala Park. Most of these areas are high growth development corridors, where prices and incomes are above average. Within these areas there are also a sizable number of property investors.
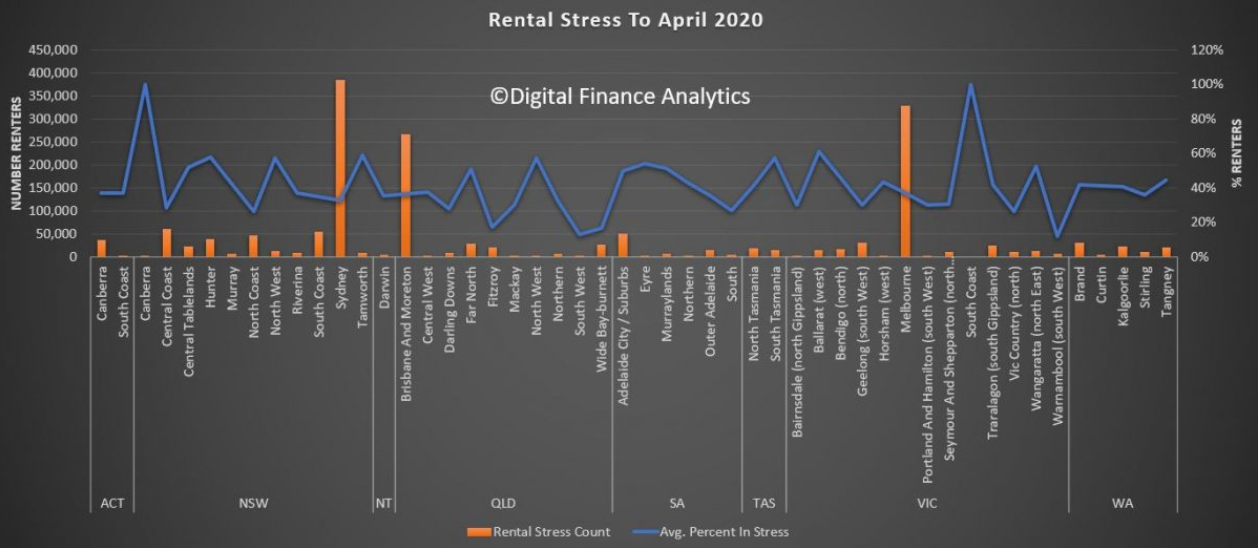
Finally, there are 1.7 million households in rental stress – defined again in cash flow terms. This equates to nearly 40% of all renting households. The regional variations are again quite stark with stress peaking in Canberra and the South Coast (where bush fire damage remains).
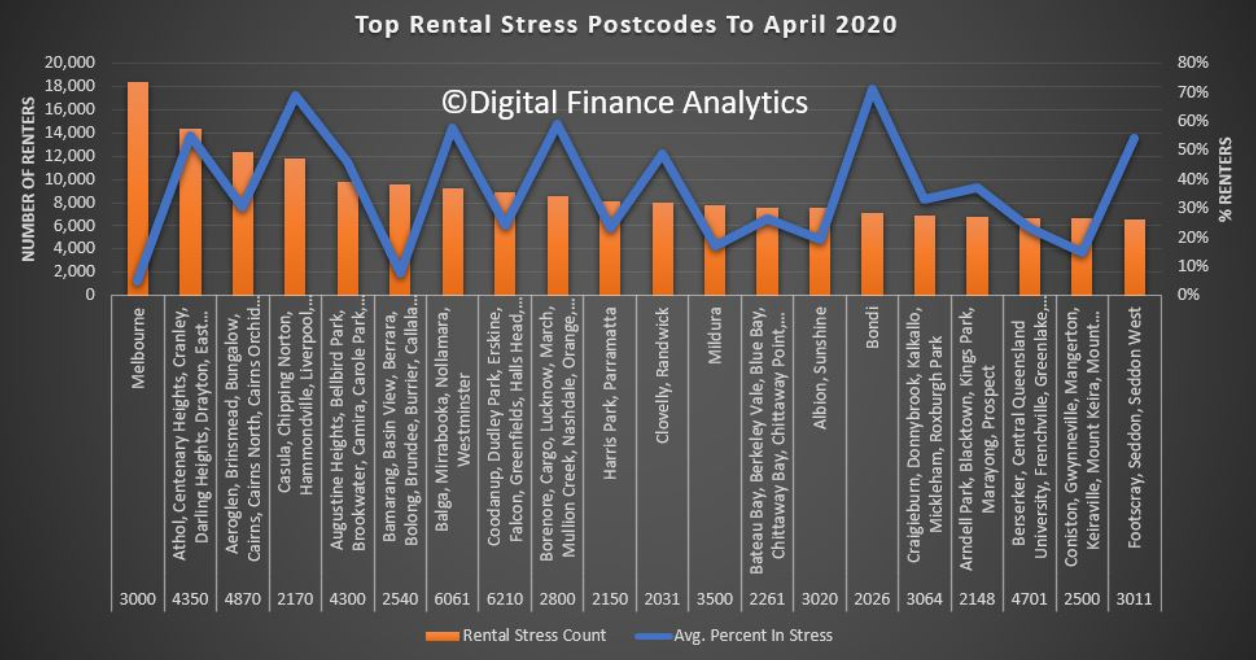
Melbourne post code 3000 recorded the highest count of rental stress, thanks to large numbers of high-rise units being built there, the loss of student and AirB&B clients and simple oversupply. But post codes in Queensland and NSW are also badly hit.
Given the trajectory of the economic downturn, we expect stress to continue to build. The most significant question is the impact of the “cliff” in September where mortgage repayments and rental default freezes, at the time when Government support schemes all are expected to terminate. Given that the June unemployment figure will likely to 10% (the true figure much higher) and according to the RBA unemployment will remain elevated through 2021, there is little prospect of the trends reversing anytime soon, even at current low interest rates.
Individual households will need to consider cutting their losses in these circumstances and as a result we expect the supply of rental property will rise, and a hike in property to list will follow later.
This has the hallmark of a long slow” U” not a “V” shaped recovery.
Too right. The rubber will really hit the road when mortgage and rent holidays end and government welfare support is wound back. That’s when mortgage and rental stress will really ratchet higher.
Leith van Onselen is Chief Economist at the MB Fund and MB Super. He is also a co-founder of MacroBusiness.
Leith has previously worked at the Australian Treasury, Victorian Treasury and Goldman Sachs.