Uncertainty in the housing market is elevated. There are many views in the market as to where house prices are heading. Some commentators believe that house prices will fall by double digits, while others believe that they could rise moderately. Notwithstanding the dispersion of views, all economists are wrestling with the idea that Australia’s borders will remain closed for an extended period of time, even when local shutdown restrictions are relaxed. “Closure” matters a lot for Australian housing at present, because migration makes up the lion’s share of population growth, and strong population growth is needed to fuel household formation at a time when heavy supply of new builds is coming on to the market. In truth though, border closures are “soft” rather than “hard”. Foreigners can still come to Australia provided they have approval from authorities and are willing to quarantine themselves for 14 days after arrival. Arguably, Australia is still “open for business”. As such, there is uncertainty about how onerous restrictions really are on population growth and household formation. Also, there is uncertainty about how many forced sales of existing homes could come on to the market. After all, listings are well down, supporting higher auction clearance rates despite rather low levels of turnover. In principle, with unemployment rising sharply, one would expect listings of foreclosure homes to be higher. But clearly, debt repayment holidays, and government cash handouts via the “Job Keeper” program are confounding factors.
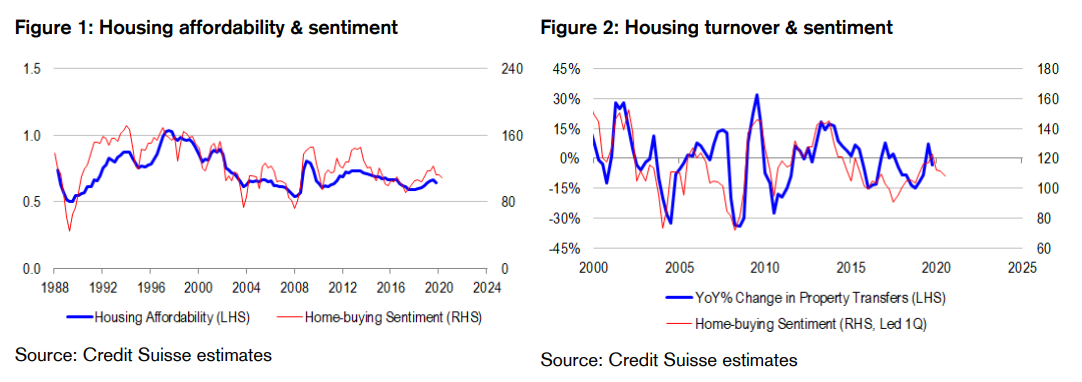
Anobjective measure of housing uncertainty. Abstracting from newsflow, views and anecdotes, there are several objective ways to measure uncertainty in the housing market. One approach is to calculate the rolling volatility of national house price inflation – but inevitably, this measure will prove to be a lagging indicator, because the most commonly followed house price indicators are measured on hedonic, settlement bases. That is, diversity among homes being bought and sold are artificially stripped out using mathematically techniques. And prices are recorded more than a month after transactions, because of contract settlement delays. With all of this in mind, we prefer to look at the dispersion of housing sentiment indicators across the country, allowing for both time series and cross-sectional variation, because housing is cyclical, and is not a homogenous asset class. Put differently, housing investors feel uncertainty about how the housing cycle is evolving, as well as about how representative national housing indices might be for the particular segments of the market they are invested in. We measure sentiment using the Westpac survey of consumers reporting whether or not it is a good (or bad) time to purchase a dwelling. Ideally, we would use house price inflation expectations by state, but long time series at the disaggregated level we are after are not available. And we feel that home-buying sentiment should be a reasonable proxy for this missing information, as it correlates well with affordability and demand, and therefore should provide a leading signal on prices. Our housing uncertainty gauge is calculated the rolling 3-month dispersion of home-buying sentiment across states. It is comparable to equity market volatlity (VIX) and swaption pricing for bonds. And at present, housing uncertainty is elevated, but not at historically high levels.
High uncertainty is a sufficient building block for portfolio construction, because Australian households are risk parity investors. Risk parity investing is based on the idea of equalizing risk contributions across components of one’s portfolio, and using leverage to achieve desired returns at lower risk. It means levering up on the lowest risk asset class as an efficient form of investing. For most multi-asset investors, this strategy means overweighting bonds relative to equities and commodities, because sovereign bonds generally have the lowest volatility of all the major asset classes, and grossing up the portfolio by around 30% to achieve “equity-like returns with bond-like volatility”. The risk parity strategy is an incredibly elegant one effectively premised on predictable, lower-for-longer rates, and lower-for-longer volatility. Australian households and their investors might not explicitly pursue risk parity strategies in managing their superannuation or voluntary saving. But they implicitly use risk parity in their portfolio allocation, because they are heavily overweight housing as their perceived lowest risk asset class, and use a lot of leverage to achieve this positioning. On the flipside, a sharp and sudden increase in the risk profile of housing has the potential to upset this positioning and wrong foot housing investors, prompting de-risking and de-leveraging. For this reason, we are less interested in forecasting the direction and magnitude of house price movements, and more interested in understanding volatility and risks of the asset class. Indeed, we think that the fact of elevated housing uncertainty by itself goes a long way toward successful portfolio construction in related universes. And this is even before testing what housing might look like in an environment with more volatile rates and geo-politics …
Housing credit growth going nowhere, but mind the composition shift. The latest available credit aggregates from the Reserve Bank of Australia (RBA) reveal that overall housing credit growth is steady at around 0.3% per month. But within this number, we note rather large composition shifts. Owner-occupier housing credit growth is picking up, while investor housing credit is shrinking. We think that this profile of growth is very consistent with policy developments and the heightened state of uncertainty in the market.
Loan approvals data ironically shed light on repayment activity. By definition, credit growth equals new loans less refinancing and repayment. We know what new loan demand and re-financing activity are like from the Australian Bureau of Statistics (ABS) housing finance approvals data. And we know what credit growth is doing from RBA aggregates. Therefore, we can “back out” net repayments from the available data. Moreover, because both the ABS and RBA now publish the breakdown of housing finance, re-financing and credit data according to owner-occupiers and investors, it is also possible to decompose net repayment estimates according to these categories.
Owner-occupier principal payments down, investor principal payments up. The detailed data reveal that owner-occupier net mortgage principal payments fell 14% in March to $8.4 billion from $9.8 billion in February. The fall in repayments is broadly consistent with data from the Australian Banker’s Association (ABA) showing that 429K mortgages, amounting to $154 billion of credit, have been deferred, roughly equivalent to 1 out of every 14 mortgages. But on the flipside, investor net principal payments rose 14% in March to $5.7 billion from $5 billion in February. Overall principal payments fell slightly, with investors offsetting the behaviour of owner-occupiers.
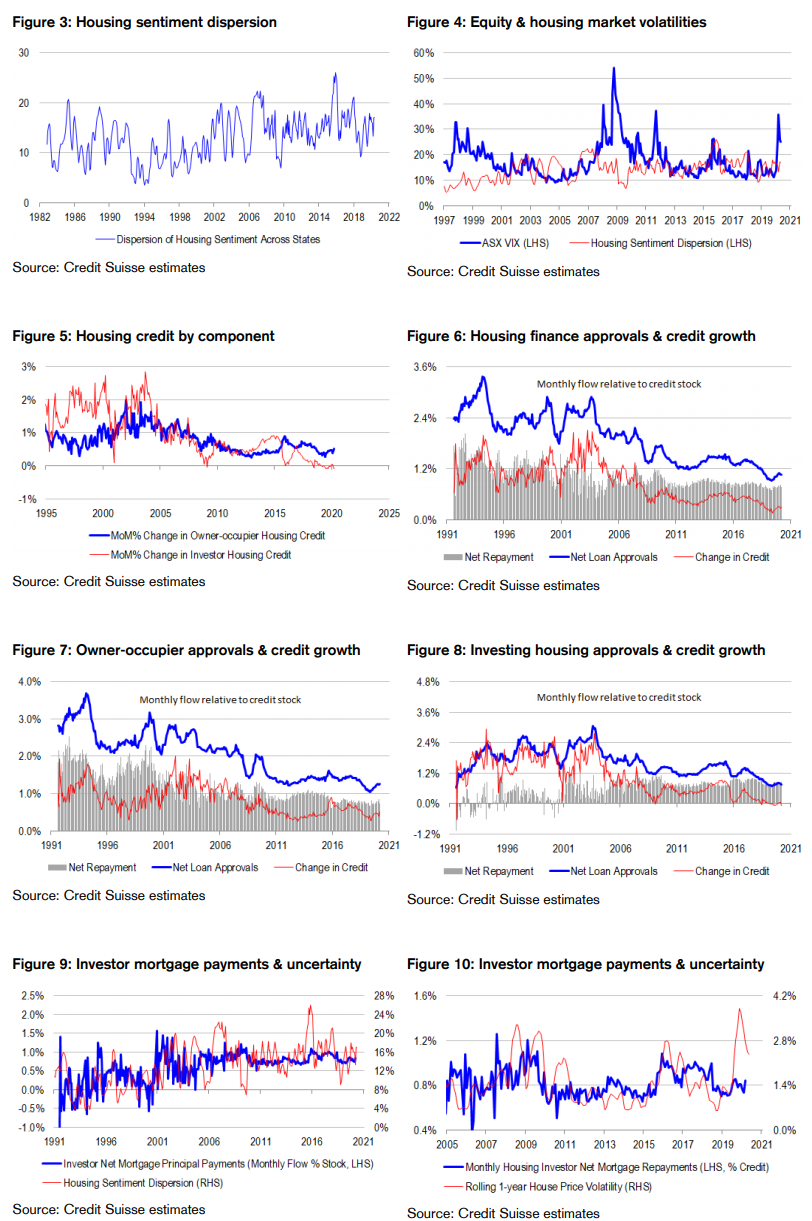
Housing investors behaving entirely rationally. Historically, housing market uncertainty leads the the rate of investor mortgage principal repayments by several months. The correlations support the idea that Australians are indeed risk parity investors when it comes to housing. The more risky housing becomes as an asset class, the more investors pay down their mortgages to reduce their leveraged exposure. And now that housing volatility is elevated, many investors are getting wrong footed in their positioning, and are responding rationally by de-risking and de-levering their housing portfolios. Accordingly, investor principal payments are rising, and are likely to continue rising in the foreseeable future. Debt relief for distressed owner-occupiers is unlikely to materially inflate the stock of housing credit in light of investor behaviour pulling in the opposite direction. And should loan approvals start to weaken in response to tighter funding conditions as well, credit growth should outright slow. Timing wise, it is distinctly possible that the slowing in private sector credit growth occurs at exactly the same time that fiscal deficit spending tapers off.
Not necessarily a disaster, but policy makers need to somehow keep a lid on volatility. It is possible that debt relief, the plunge in listings, and thinly liquid conditions in the housing market might obfuscate price discovery in the market, perversely limiting measured house price volatility. But if policy makers were to rely on these factors to cut off de-leveraging risks, they would essentially be banking on hope as a strategy – hope that the constraints from COVID-19 might disappear quickly enough to enable a full re-opening of the economy – even the borders – so as to strengthen the claim that oversupply in the housing market is temporary and to give participants reason to hold out for a while longer. They would be putting all their eggs in one basket. We think that more stimulus needs to come through, or at least be advertised, to keep the housing market near its “unhappy” equilibrium. But monetary policy is largely tapped out now that the Bank has cut rates to 0.25%, and is in the phase of actively managing its quantitative easing program. Another tempting option is to “softly” re-open the borders, although we suspect government officials will think long and hard about the risks having failed the first time to prevent COVID-19 from reaching Australian shores, and having inflicting significant damage on the economy through its shutdown response. The “nuclear” option is to somehow use the public sector’s balance sheet to support the housing market whether directly through purchases or indirectly through generous loan guarantees and subsidies. Alternatively, policy makers could allow market forces to run their course.
The full text of this article is available to MacroBusiness subscribers
David Llewellyn-Smith is Chief Strategist at the MB Fund and MB Super. David is the founding publisher and editor of MacroBusiness and was the founding publisher and global economy editor of The Diplomat, the Asia Pacific’s leading geo-politics and economics portal.
He is also a former gold trader and economic commentator at The Sydney Morning Herald, The Age, the ABC and Business Spectator. He is the co-author of The Great Crash of 2008 with Ross Garnaut and was the editor of the second Garnaut Climate Change Review.