

By Chris Becker
The risk edifice continues to push higher, helped along by a reduction in continuing jobless claims in the US even though all the other economic markers show the world’s biggest economy in a deepening recession. Wall Street stumbled at the finish due to some Trump remarks with US Treasury yields rising slightly, the USD weakening against most of the majors while oil and gold prices stabilised.
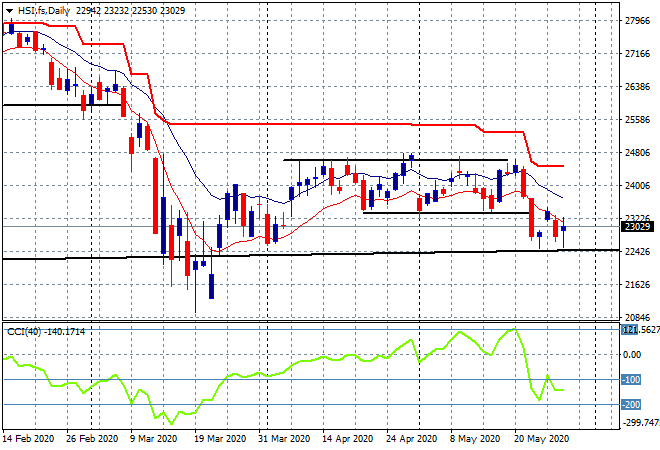
Looking at share markets from yesterday where in mainland China the Shanghai Composite was up 0.3% to 2846 points, while the Hang Seng Index was looking to finish with a scratch session, but sold off at the close to be down 0.7% to 23132 points. This keeps it below previous firm support at the 23300 point level, but just above the long term trendline and a return to the March lows but it needs to do something fast or is going to slip below:
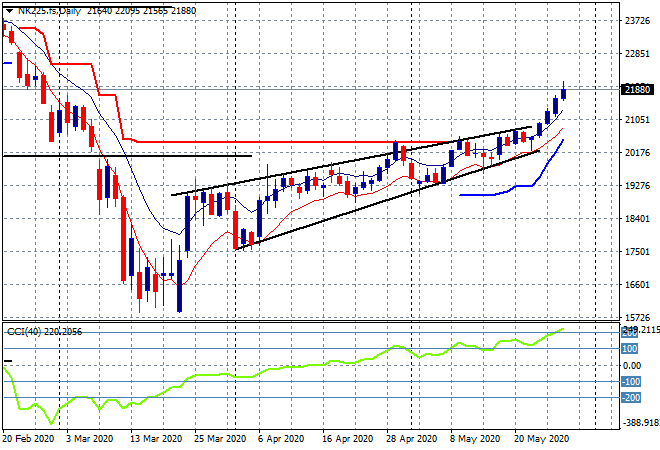
Japanese share markets continued their way too fast and too far rally, with the Nikkei 225 surging more than 2% higher to 21916 points. The daily price pattern has been the most promising of all risk markets for sometime but is looking the most dangerous now as the potential for a blowout accelerates as momentum is extremely overcooked:
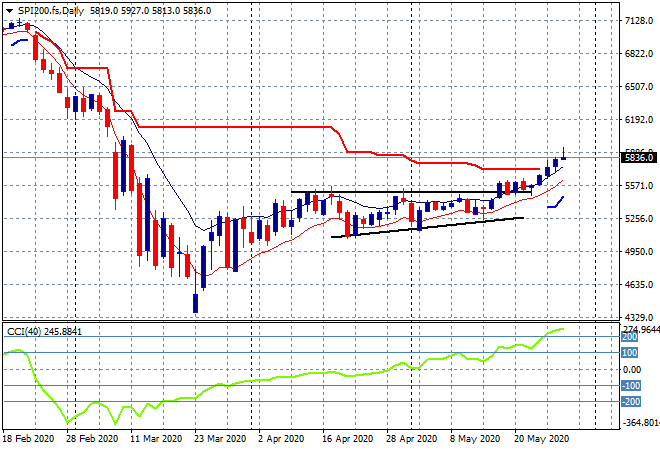
The ASX200 had a solid session all day as bank stocks caught up with the rest of the stinking edifice, lifting more than 1,.3% to 5853 points. SPI futures are down over 20 points because of the lat falls on Wall Street so maybe some sanity will prevail going into the end of the week but superannuation funds really want to hit that 6000 point level before the end of the month:
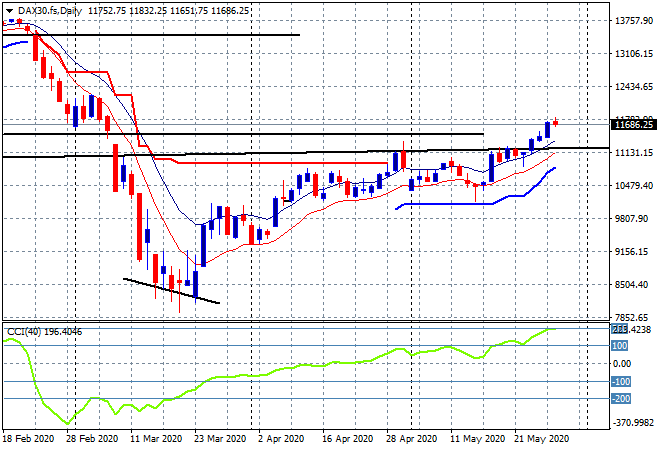
European markets kept up the positive mood and then some with further gains across the continent as the German DAX finished another 1% higher at 11781 points. Momentum is now moving into extremely overbought levels with the potential for a short term inversion rising:
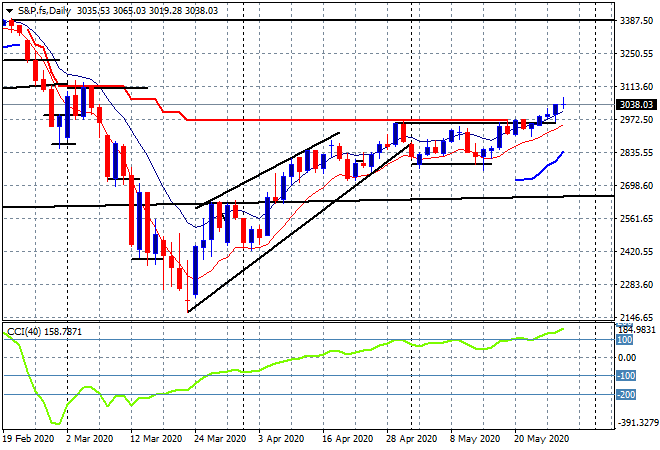
Wall Street was tracing the same path as European markets but stumbled at the close due to Trumps remarks on China or Twitter or something, with the broader S&P500 falling 0.2% to remain just above the 3000 point level. A close above here to end the week seals the fate for short sellers:
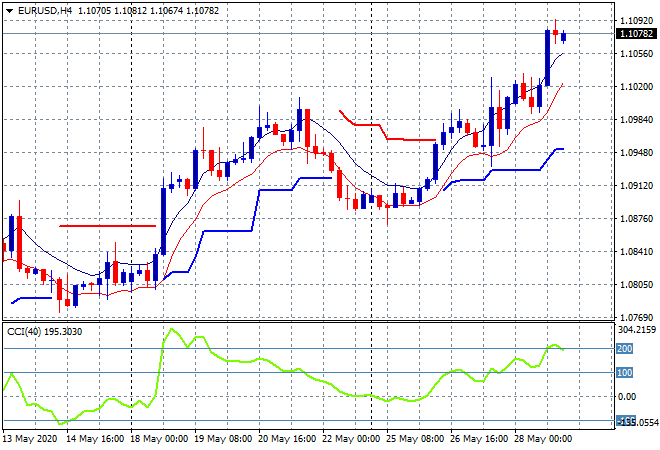
Onto currency markets where the USD strength is evaporating with Euro bursting once more bursting out the gates to breach the 1.10 handle for a new weekly high. There was considerable resistance at that psychological key level but this was brushed aside and now we look for a very short term reversion to the mean trade back below the high moving average and then another leg higher:
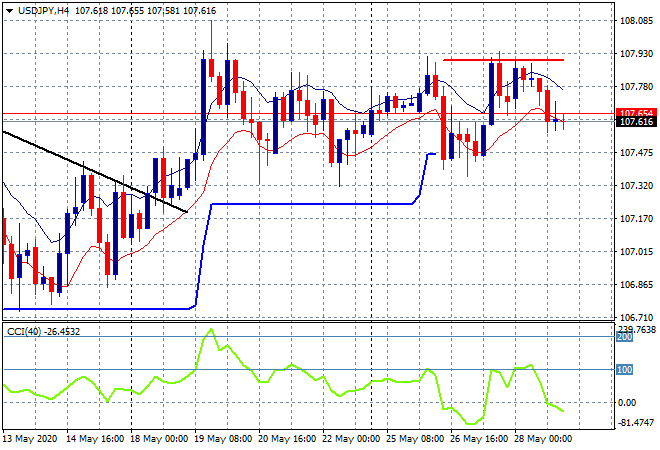
The USDJPY pair fell back again after being rebuffed once more at the 108 handle. This shows an inability to return to its previous early week highs with this consolidation phase above daily and four hourly ATR support possibly turning into a reversion to the late April/early May lows. Momentum remains negative on the four hourly chart so watch the 107.30 area for signs of a breakdown:
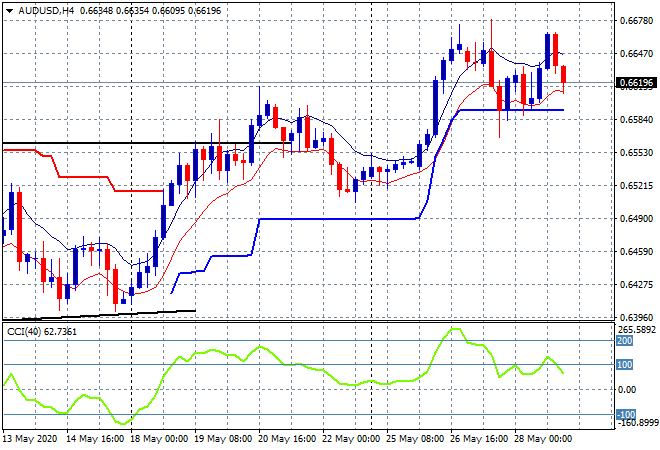
The Australian dollar was the trader’s choice overnight with a push up towards the 67 handle and then a sharp reversal to back where it started in the midst of the European/US data releases. Price remains above last week’s intraweek high at the 66.20 level which should support further buying but there is the potential for a bearish double top pattern here on the four hourly chart:
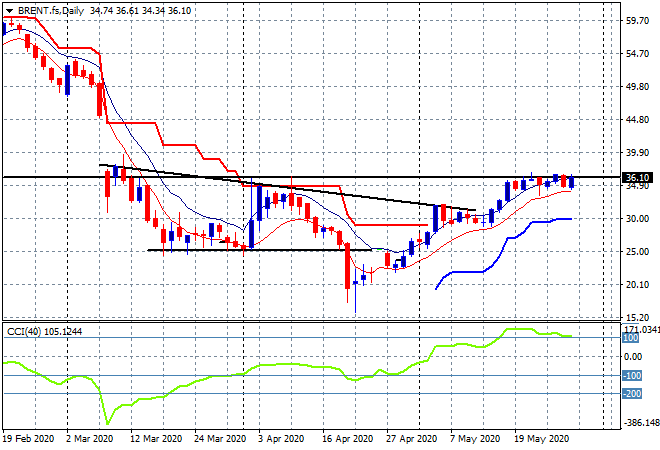
Oil prices are still maintaining positive momentum – in the main – alongside stocks with Brent crude up nearly 1% to be just above the $36USD per barrel level as it starts to push up against its post-breakdown resistance level. Momentum is still clearly behind oil prices, and I still wouldn’t be surprised at another blowout that could even hit the $40 level before all the longs are exhausted:
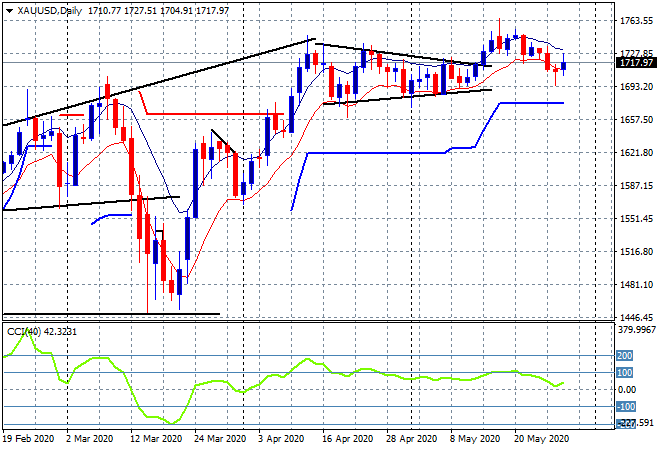
And, finally to gold, which after deflating all week finally found some lift overnight with a blip back above the $1700USD per ounce level. This short term inversion below $1700 due to the lack of further buying support may be over before it starts with very firm support below, so now watch for a follow through above the high moving average at $1730:
Glossary of Acronyms and Technical Analysis Terms:
ATR: Average True Range – measures the degree of price volatility averaged over a time period
ATR Support/Resistance: a ratcheting mechanism that follows price below/above a trend, that if breached shows above average volatility
CCI: Commodity Channel Index: a momentum reading that calculates current price away from the statistical mean or “typical” price to indicate overbought (far above the mean) or oversold (far below the mean)
Low/High Moving Average: rolling mean of prices in this case, the low and high for the day/hour which creates a band around the actual price movement
FOMC: Federal Open Market Committee, monthly meeting of Federal Reserve regarding monetary policy (setting interest rates)
BOJ/Abenomics: Bank of Japan, economic policy/direction enacted by PM Shinzo Abe
DOE: US Department of Energy Uncle Point: or stop loss point, a level at which you’ve clearly been wrong on your position, so cry uncle and get out!