

By Chris Becker
A better mood on risk markets overnight as more regions and countries announce easing on lockdowns in the face of the coronavirus impact, with markets still pricing in a sharp V-shaped recovery. European markets did the best until the German constitutional court put a dampener on the ECB’s asset purchase program, while commodities had a big surge with both oil markers up over 10%, industrial metals also lifting but the Aussie dollar not going along with the party.
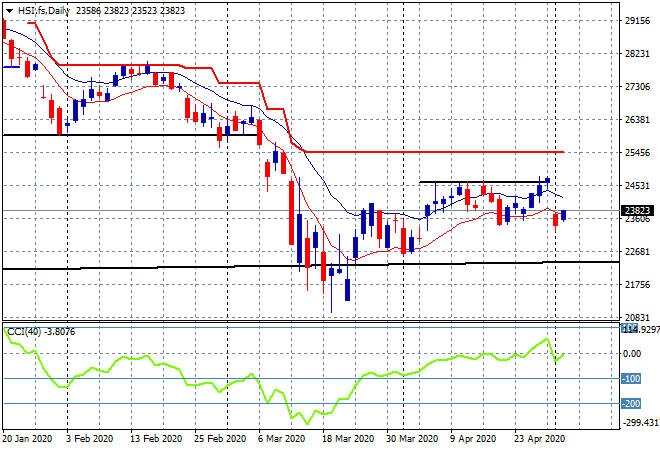
Looking at Asian share markets from yesterday where mainland Chinese share markets were closed again but the Hang Seng Index bounced back somewhat to be close just over 1% higher at 23868 points, trying to claw back the previous losses and keeping key support firm at 23000 points. This firmly puts the index on an at best sideways trajectory for the time being as the May effect rolls on:
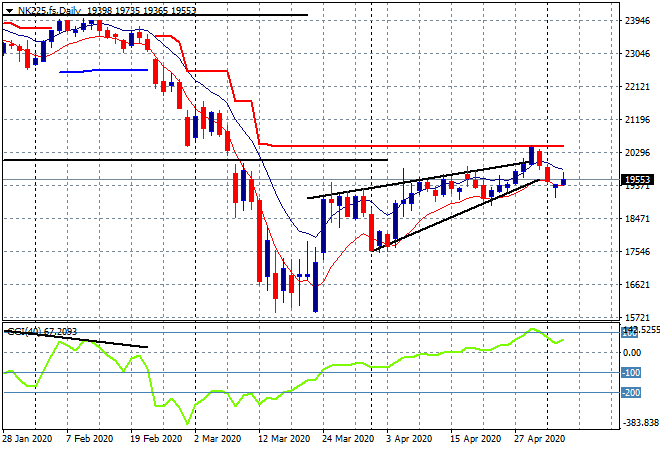
Japanese share markets are closed through to Wednesday. The daily futures chart of the Nikkei 225 was in a strong position to push this breakout higher, but we’ll have to wait and see as other risk markets are sending very mixed signals:
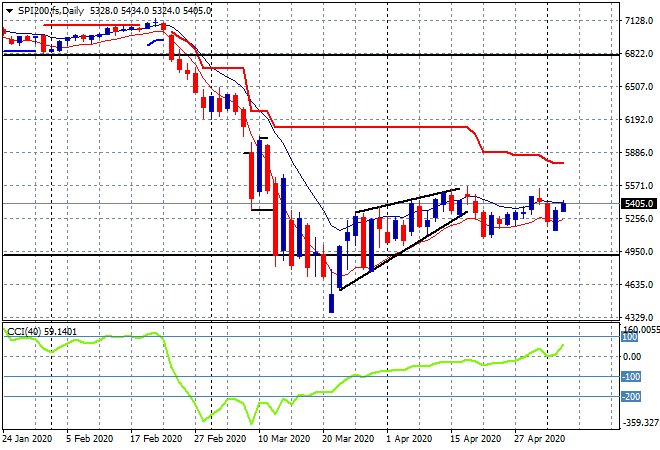
The ASX200 had a more ebullient day with a 1.6% surge higher, closing at 5407 points, making another dent from its losses on Friday. SPI futures are down around 0.2% or so with support still firming here at the 5200 point area, but still not enough strong momentum to overcome the bears as overhead resistance at the 5550 level remains too strong. Watch for a pullout above the previous daily highs at 5570 or so to put that theory to bed:
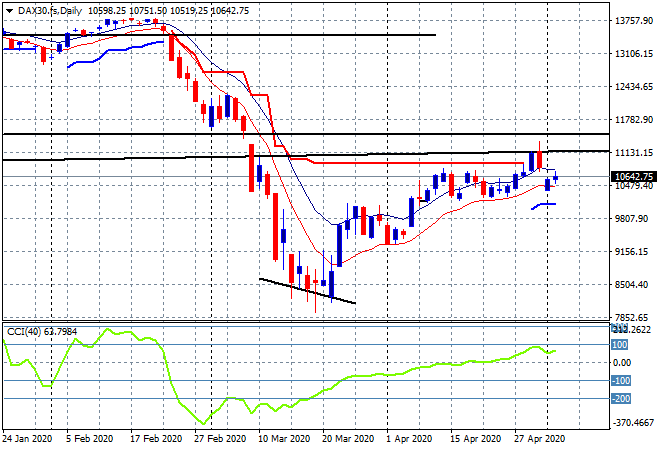
European markets continued in a solid good mood until after the market with the reaction to the German court’s decision on the ECB, with the German DAX closing 2.5% higher at 10729 points to clawback most of its snapback losses. Futures aren’t looking as bright though in response and although daily momentum remains positive, I’m watching for a failure to get back above the high moving average tonight as a sign that there’s still little upside opportunity in the short term:
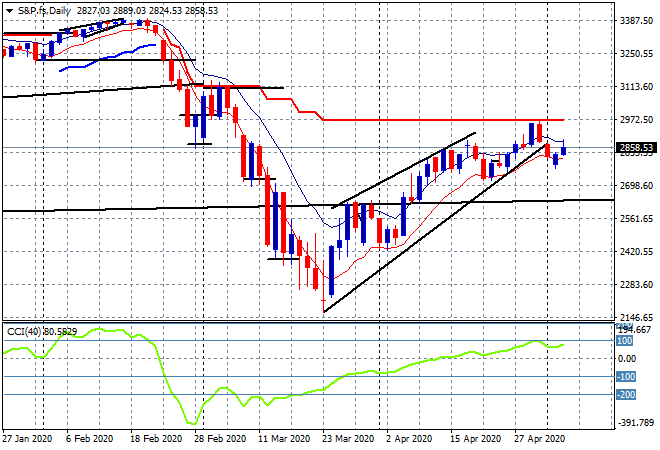
Wall Street was firm across the board with the NASDAQ up over 1.1% while the broader S&P500 finished up 0.9% to 2868 points. The daily chart shows price trying to get back above the lower trendline as trailing ATR resistance at the 3000 point level grows ever stronger, but the BTFD crowd is still going all in to stabilise this picture, pricing in all the economic upside as the ‘States “get back to business”:
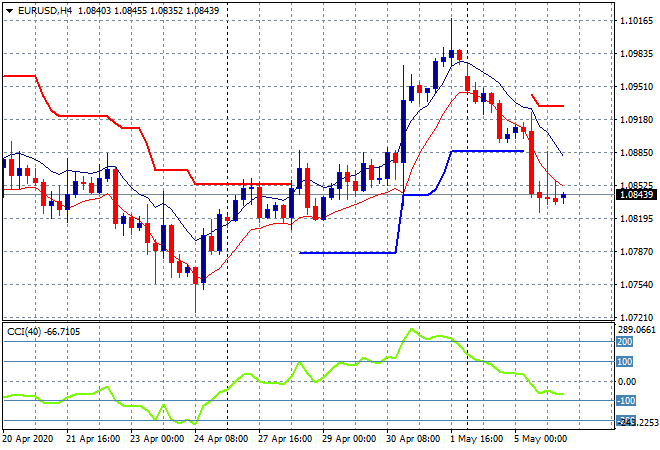
Onto currency markets where volatility around USD is still all about Euro with the union currency slumping through trailing ATR support on the four hourly chart back towards the 1.08 handle. As I said yesterday, key level at the 1.09 handle proper is the area for signs of a breakdown and here we are as the medium term downtrend reasserts itself. I’m watching for a new four hourly session low here to re-engage the shorts:
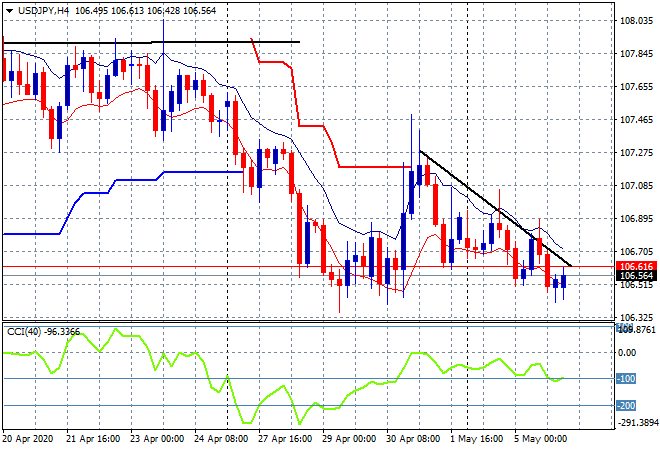
The USDJPY pair remains relatively sanguine given the lack of trading in Asia locally, still stuck at the mid 106 level. Momentum readings remain in the doldrums from the Friday night peak overshoot and I would contend it’ll stay somewhere near here until traders return to their desks on Thursday:
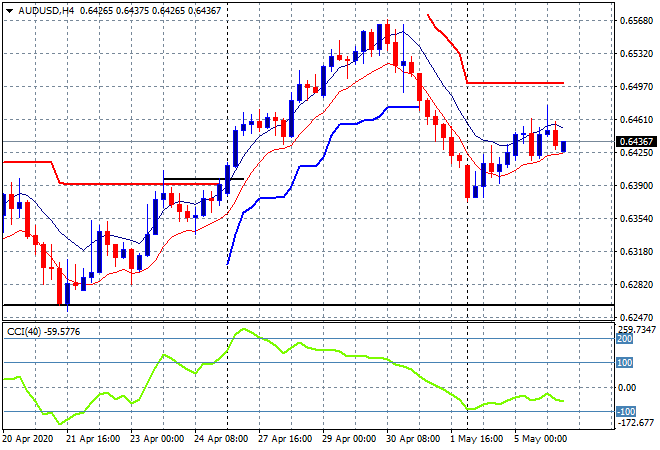
The Australian dollar slowed down from its Monday morning gap snapback, failing to breach the 65 handle and consolidating at the low 64’s overnight. Yesterday’s RBA meeting failed to ignite any risk taking despite a rise in commodity prices overnight, so watch for a possible inversion below the low moving average at the 64.20 level:
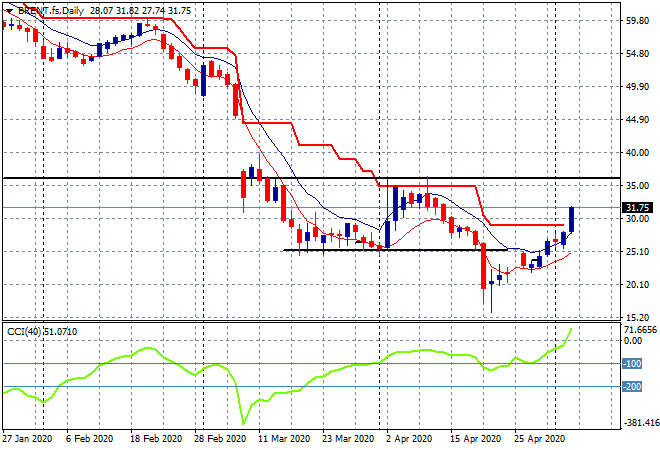
Oil volatility continues on a very positive bent with Brent crude soaring 13% overnight, doubling down on it strong start the week to finish nearly at the $32USD per barrel level. This takes my swing trade idea way past the trailing ATR resistance area around $30 and puts it on track for a return to the yearly low nearer $35:
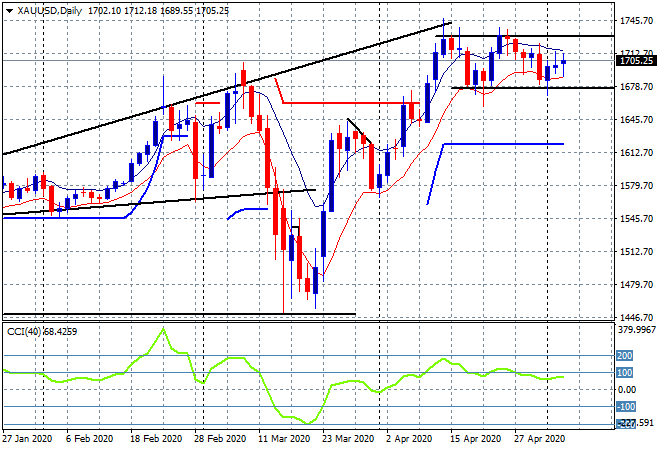
Finally to gold, which continues to consolidate here around the $1700USD per ounce level, lifting a little overnight to be at $1705USD per ounce. The daily chart is morphing into a rectangle pattern with support at ca. $1680 and resistance near $1730 at the respective lows and highs, with longer term charts still supporting a further uplift, but a retracement down to daily ATR support or previous resistance at $1650 would not be surprising:
Glossary of Acronyms and Technical Analysis Terms:
ATR: Average True Range – measures the degree of price volatility averaged over a time period
ATR Support/Resistance: a ratcheting mechanism that follows price below/above a trend, that if breached shows above average volatility
CCI: Commodity Channel Index: a momentum reading that calculates current price away from the statistical mean or “typical” price to indicate overbought (far above the mean) or oversold (far below the mean)
Low/High Moving Average: rolling mean of prices in this case, the low and high for the day/hour which creates a band around the actual price movement
FOMC: Federal Open Market Committee, monthly meeting of Federal Reserve regarding monetary policy (setting interest rates)
BOJ/Abenomics: Bank of Japan, economic policy/direction enacted by PM Shinzo Abe
DOE: US Department of Energy Uncle Point: or stop loss point, a level at which you’ve clearly been wrong on your position, so cry uncle and get out!