By Gareth Aird, Head of Australian Economics at CBA:
Key Points:
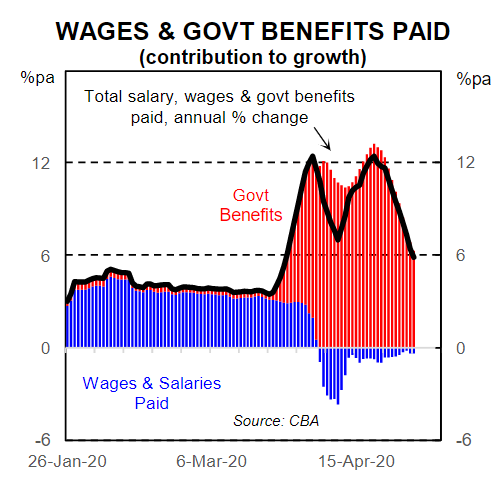
The increase in government benefit payments, which excludes JobKeeper, continues to be bigger than the fall in wages and salaries paid, albeit growth in household income has eased over the past few weeks.
Fiscal stimulus is plugging the income gap from the big contraction in hours worked.
The negative shock to household income is likely to arrive later in the year when government payments are wound back.
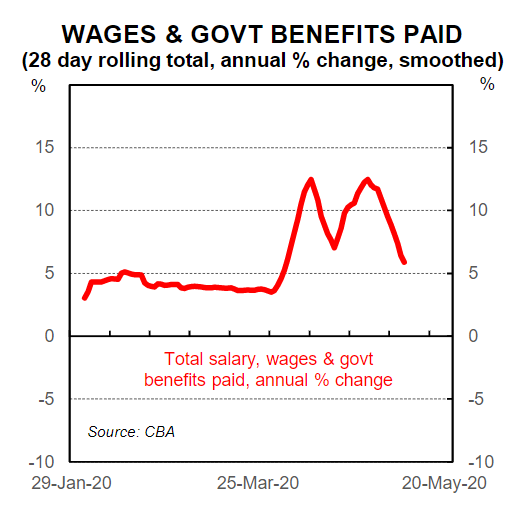
Overview
Updated analysis from payments into CBA bank accounts indicates that a counterintuitive dynamic has remained in play to the week ending 8 May 2020. As the economy contracts, spending falls and jobs are lost, our data reveals that a positive income shock has likely been underway so far in the household sector over Q220. More specifically, at an aggregate level the reduction in household income from job losses to date has been more than offset by an increase in government benefit payments. The annual growth rate in our partial read on household income that comprises wages and salaries paid plus government benefits paid has eased over the past two weeks. But it is still running abovepre-COVID-19 levels. This note discusses the details.
Wages and salaries paid
Our wages and salaries data captures all wages and salaries paid into CBA bank accounts. In essence it is picking up changes in the level of employment, wages growth and hours worked. It includes JobKeeper, however we are unable to quantify the amount of JobKeeper within wages and salaries. JobKeeper payments from the ATO to employers only started on 7 May 2020 but employers have been paying it to employees through April (i.e. the ATO is paying employers ~one month in arrears). According to the Government more than 6 million people across 860,000 businesses are now on JobKeeper payments.
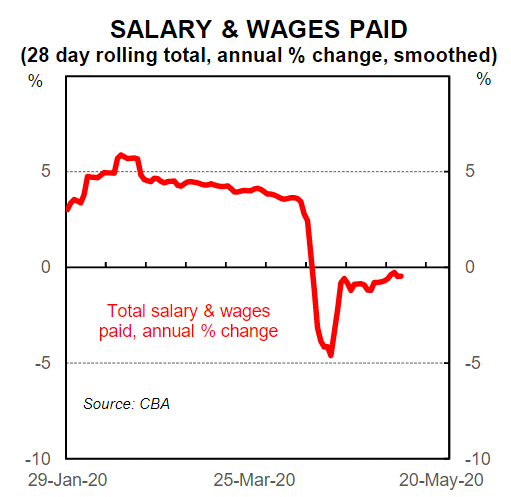
Our data indicates that total wages and salaries were running at ~5%/yr over the early part of 2020 (very similar to the national accounts measure of compensation of employees which was 4.8%/yr in Q4 19). That rate of growth dropped sharply by mid-April to be down ~3%/yr, but has since recovered to sit at-0.5%over the year.
The negative wages and salaries shock is best measured by looking at the change in growth rates from where we were tracking pre-COVID-19 to where we are today. It suggests that there has been a contraction in wages and salaries of ~5½% from where we would have been travelling without the COVID-19 pandemic. On the surface this doesn’t seem large enough given the ABS payrolls point to job losses of around 7½% (note that this differs from the change in employment as per the April labour force survey). But the type of jobs that have been lost matters when considering the shock to income. We have lost a disproportionate number of lower income, casual jobs in hospitality and recreation. This means that the hit to the total wages and salaries bill is less than the change in jobs. It is very much the opposite of the situation post mining boom where a disproportionate number of highly paid jobs were lost.
Government benefits paid
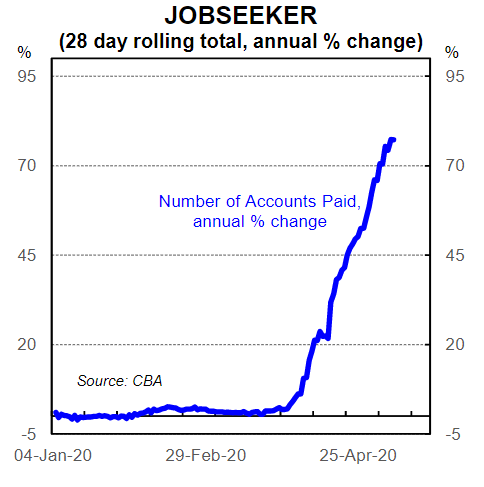
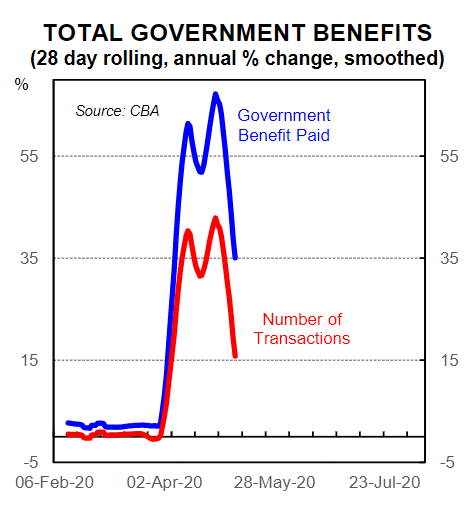
Growth in government benefits paid into CBA bank accounts has eased over the past week after running at very elevated rates over April. The last of the cash payments of $A750 to 6.5million Australians were paid on 13 April 2020. We calculate our annual change in benefits on a rolling 28 day basis so the growth rate has slowed as the $A750 payments have “dropped out”. But there has been a partial offset as the number of people receiving JobSeeker has grown. According to our data there has been a ~77% increase in the number of bank accounts receiving JobSeeker. In addition, the JobSeeker payments have doubled from 27 April. The net result has seen total government benefits paid ease to a still very large +35%/yr as at 8 May 2020.
Our partial read on household income
Combining wages and salaries paid into CBA bank accounts with government benefits paid gives us a partial read on household income (it excludes rents, interest earned, dividends and a few other things). Our data indicates that on this measure alone the size of the increase in government benefits paid continues to be bigger than the drop in wages and salaries paid to date. The net result has seen growth in household income rise.
We were very surprised to see the RBA forecast real household disposable income to decline by 8%/yr in Q2 20. We find it very hard to see how the RBA came up with such a forecast given what we have observed in real time in terms of payments into CBA bank accounts. It looks to us like the negative shock to household income is likely to arrive later in the year when government payments are wound back.
The Government has used the analogy of building a bridge to take Australia over the worst of the COVID-19 pandemic. Our income data indicates that bridge has indeed been built. If we do not suffer setbacks in the re-opening of the economy then the damage to the household sector will have been very well contained by the huge fiscal stimulus.