

By Chris Becker
Stock markets were unable to translate gains in Asia to anything substantial in the northern hemisphere overnight as caution reigned with disappointing news regarding an antiviral drug plus a big spike in initial jobless gains keep sentiment tempered. Euro fell on internal EU squabbling over debt agreements while commodities were mixed with oversold oil bouncing back a little, iron ore falling while gold moved solidly moving higher above $1700USD per ounce again.
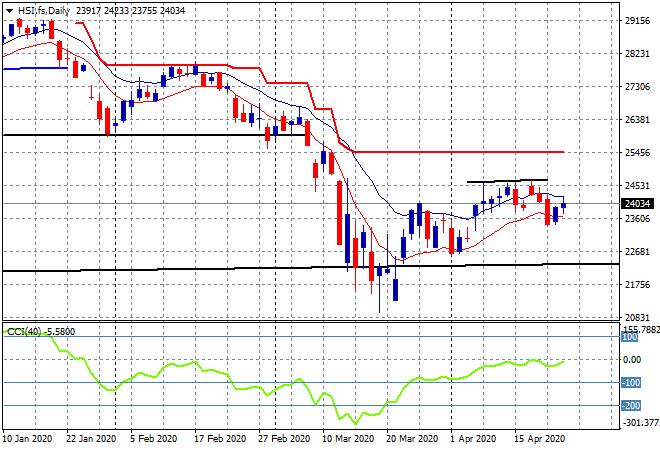
Looking at Asian share markets from yesterday where the Shanghai Composite closed some 0.2% lower after being higher during the session, finishing at 2847 points while the Hang Seng Index put in a more solid session, closing 0.3% higher to 23977 points, as daily price action keeps the rollover lows away and edges back towards the recent highs. Daily momentum is still not positive here with resistance overhead (short black line) at the 24600 point level unable to be breached, but the bears remain at bay:
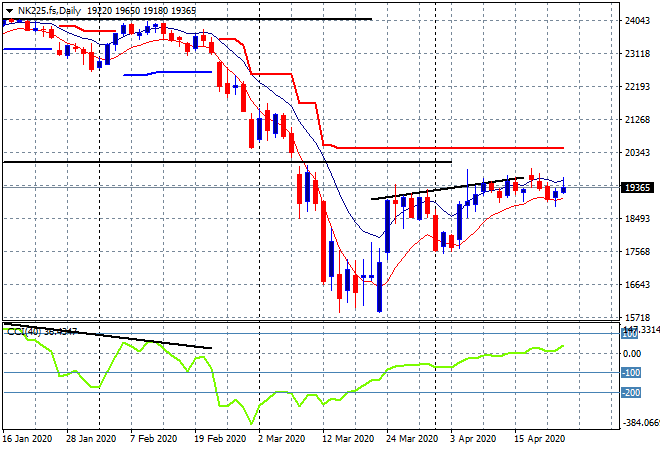
Japanese share markets came back with the Nikkei 225 closing nearly 1.6% higher to get back to 19429 points. The daily chart is looking a little stronger as a result as the market has a slightly different rising wedge pattern to other bourses, but it still exists in its bearish form and is ready to break below the low moving average if things turn further sour:
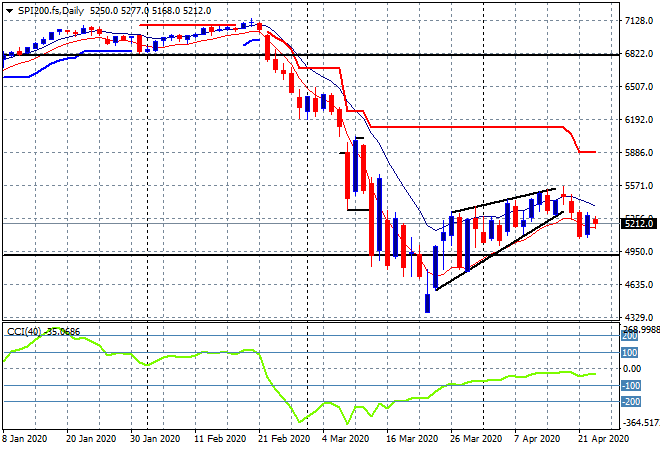
The ASX200 had another flat session after being up more than 1% at the open, closing 0.1% lower at 5217 points. SPI futures are up 12 points or so due to the mixed mood on Wall Street with some end of week window dressing likely. Again, another bearish rising wedge pattern that had been forming slowly on the daily chart but requires a definitive break of the 5000 point level before calling this rally done:
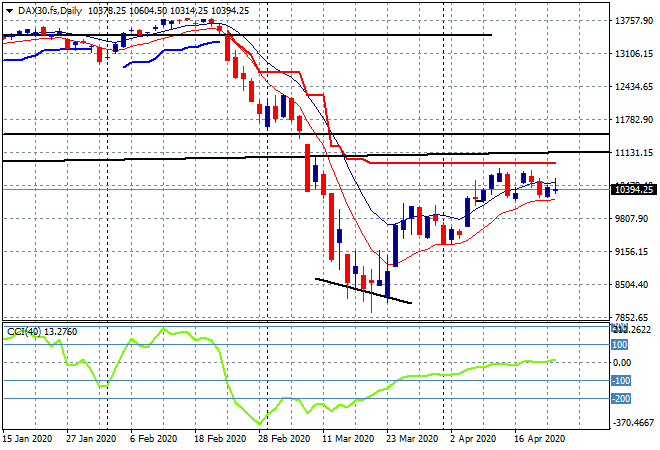
European markets opened weakly then spiked mid session before finishing with solid results as the German DAX closed 1% higher to 10513 points before futures saw most of those gains taken back as Wall Street wobbled. The daily chart is still showing significant resistance overhead but as I said previously with the low moving average and the psychologically important 10000 point level intact, the breakdown is not yet here, but daily momentum is waning:
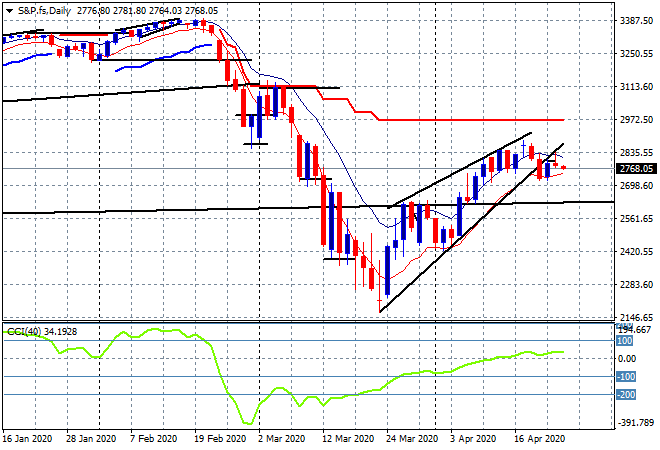
Wall Street had the wobbles very late in the session after being up more than 1% with the S&P500 finishing 1.5 points lower to 2797 points, just enough to keep the bears off for another day. The daily is still showing a technical breakdown of the bearish rising wedge pattern but still requires a solid confirmation if it spills through the 2600 point level:
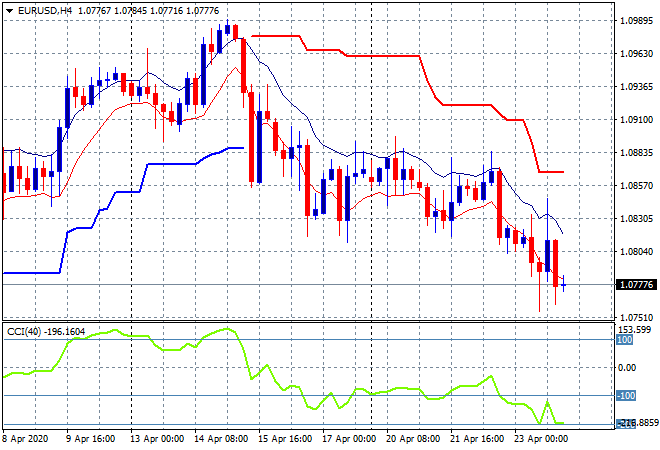
Onto currency markets where there was a lot of intrasession volatility around USD, but Euro went its own way eventually as PMIs came in, forcing a new intraweek low below the 1.08 handle, confirming the medium term downtrend. While the union currency is considerably oversold there has been no evidence of buying here to justify the usual reversion trades:
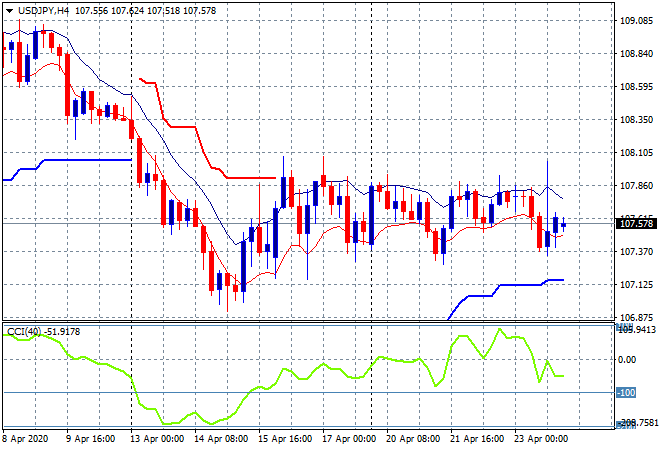
The USDJPY pair is still in a wait and see mode, currently hovering at the mid 107s but did experience a violent spike overnight as part of the economic data reaction. I’m still watching momentum readings here on the four hourly chart which require another push higher to convert this from a swing play into something more substantial, but have so far been lacking:
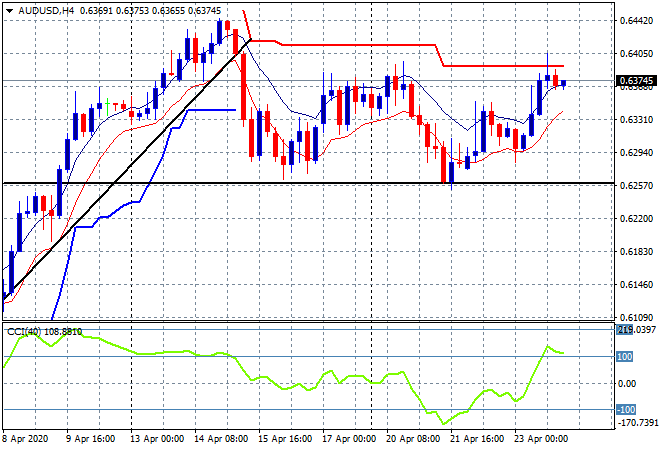
The Australian dollar surged alongside other commodity currencies to finish well above the 63 handle this morning and getting back to last week’s high, just below trailing ATR resistance on the four hourly chart. I was watching the high moving average for a potential swing breakout and here we are but can it be sustained over these matching price levels?
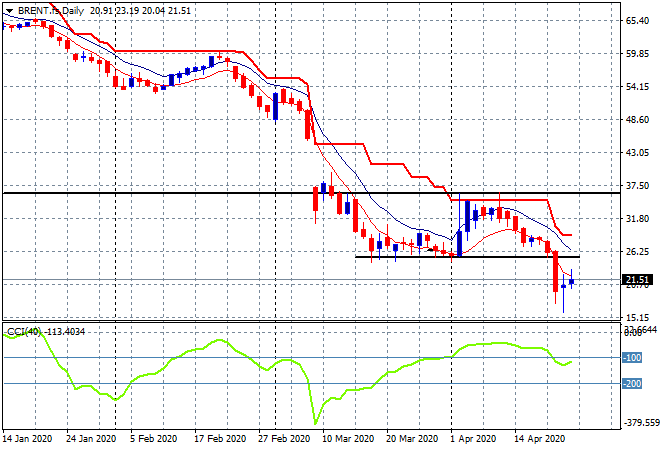
Oil remains extremely volatile despite the small ranges visible on the daily candle with Brent crude marker lifting again to settle at the mid $21USD per barrel overnight. Yesterday I noted a daily candle indicating a possible bottom – a morning star pattern – but that could be clutching at hope for a big bounce higher. Margins on all oil trading contracts have exploded so its really only worthwhile as an unleveraged long play – would you buy at this level?
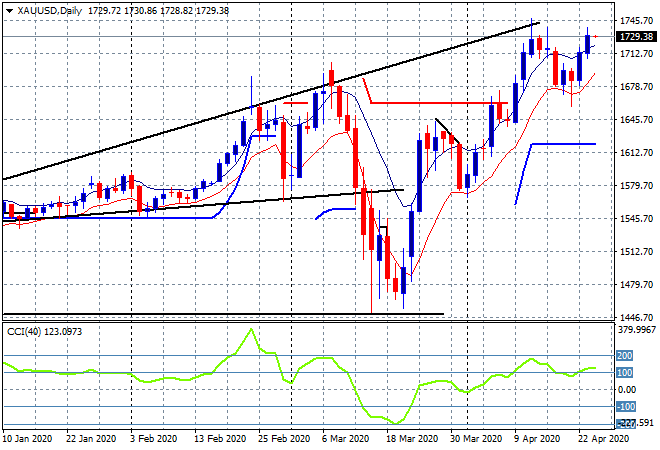
Finally to gold, which continues to lift higher after building above the $1700USD per ounce level, now matching its previous highs to close at $1729USD per ounce. The daily chart is firming here in the short term to catch up again with the longer term technical picture which is to keep advancing:
Glossary of Acronyms and Technical Analysis Terms:
ATR: Average True Range – measures the degree of price volatility averaged over a time period
ATR Support/Resistance: a ratcheting mechanism that follows price below/above a trend, that if breached shows above average volatility
CCI: Commodity Channel Index: a momentum reading that calculates current price away from the statistical mean or “typical” price to indicate overbought (far above the mean) or oversold (far below the mean)
Low/High Moving Average: rolling mean of prices in this case, the low and high for the day/hour which creates a band around the actual price movement
FOMC: Federal Open Market Committee, monthly meeting of Federal Reserve regarding monetary policy (setting interest rates)
BOJ/Abenomics: Bank of Japan, economic policy/direction enacted by PM Shinzo Abe
DOE: US Department of Energy Uncle Point: or stop loss point, a level at which you’ve clearly been wrong on your position, so cry uncle and get out!