

By Chris Becker
Another big surge on Wall Street as hope and delusion continued to be mixed up by traders watching case counts of COVID-19, instead of the underlying macro problems mounting. Oil prices continued to fall despite the OPEC+ production cut promises, with the USD falling alongside against all the majors as gold remained well above the $1700USD per ounce level.
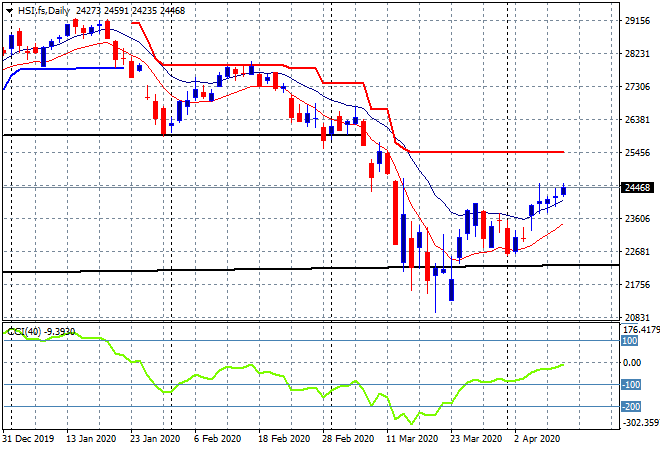
Looking at Asian share markets yesterday, where the Shanghai Composite surged into the close, finishing 1.6% higher to 2827 points while the Hang Seng Index closed 0.5% higher to 24435 points, building above its high moving average on the daily chart. This breakout is getting more interesting with growing support at the 23000 point level to keep this rally up towards 26000 or so, the previous uncle point before this selloff:
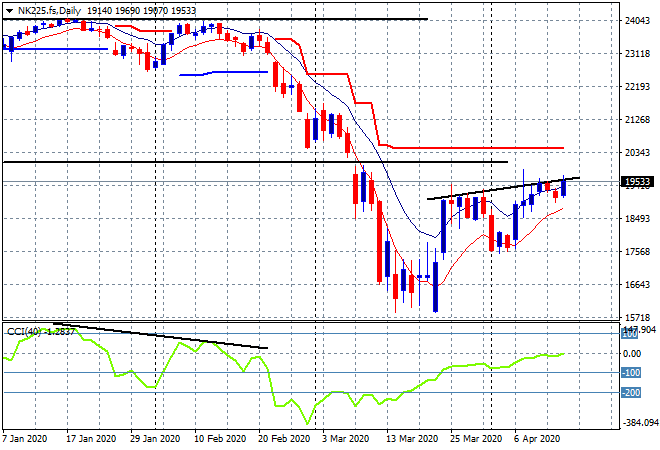
Japanese share markets were the standout again with Nikkei 225 eventually closing some 3% higher at 19638 points, now up over 13% for the month. The daily chart shows price slowly melting higher but still anchored a little at the 19000 point level with momentum still not yet positive but still looking good all round until we hit the psychologically important 20000 point level:
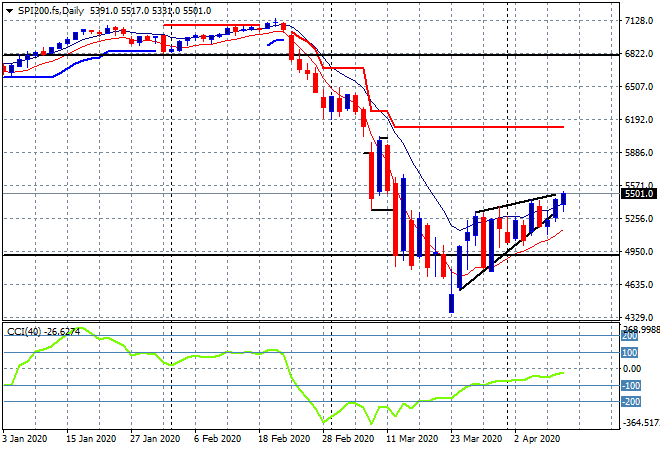
The ASX200 finished 100 points or nearly 2% higher at 5488 despite the Aussie dollar making good on its one week rally. SPI futures are only up about 10 points despite the big rise on Wall Street overnight. There’s a bearish rising wedge pattern on the daily chart, but I think hope is going to push past this structure above 5600 points even as volatility remains high:
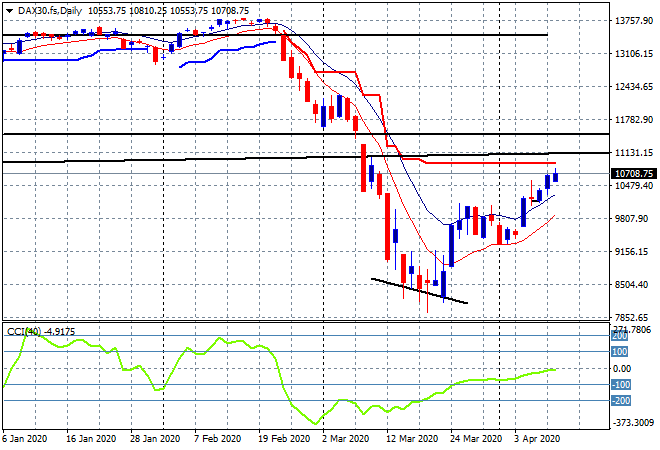
European markets reopened after the Easter long weekend, with the German DAX climbing 1.2% to 10696 points as the daily chart clearly shows a breakout above the moving average band as momentum becomes positive. This is a solid relief rally, but I remain cautious below the strong resistance levels (black horizontal and sloping lines) above:
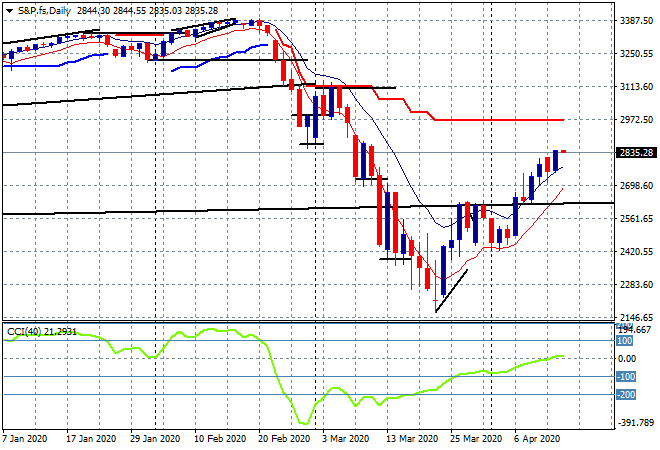
Wall Street was exuberant again overnight with the S&P500 lifting more than 3% to finish at 2846 points almost back to square one for the previous 12 months. The daily chart is still in breakout mode with the next target up at 3000 points as this bear market rally gains momentum, clearing one area of doubt until the next one hits:
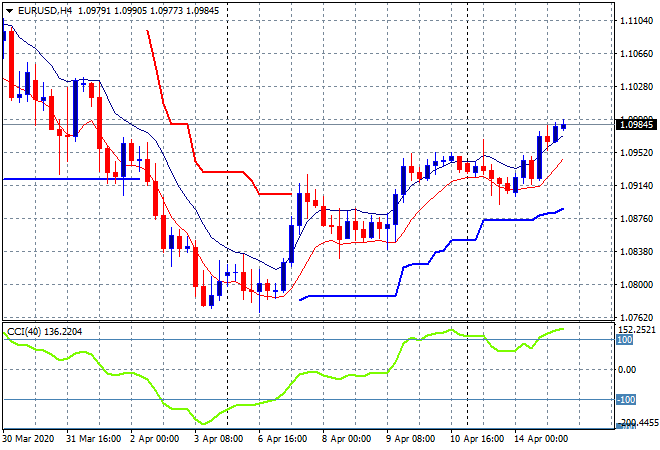
Onto currency markets where the USD was sold off against the majors with Euro finally getting some momentum above the 1.09 handle as it consolidated around marginal support at that level at the start of this short week. I’m watching for the 1.10 level to be breached next which could send more signals for risk taking:
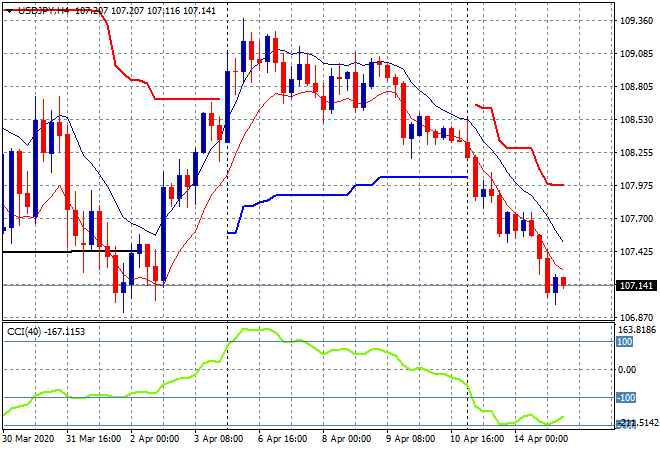
The USDJPY pair is still in full deflation mode, heading back towards the 107 handle, now back at the previous weekly lows and looking extremely stretched here. Watch for some consolidation and easing of selling at this level in the short term:
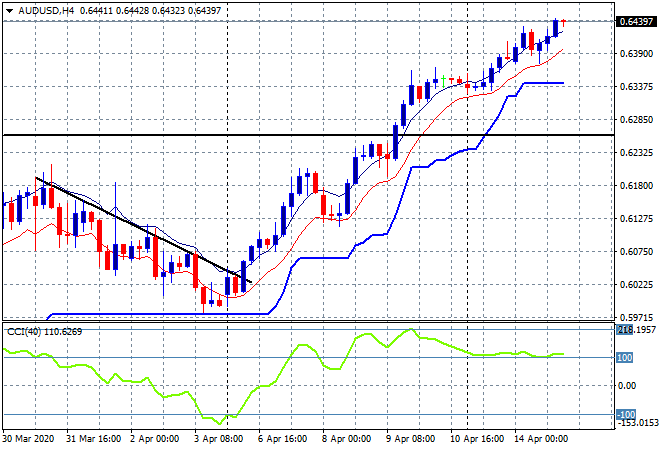
The Australian dollar is roaring ahead with a break above the 64 cent level overnight, following last week’s RBA meeting as the catalyst. Momentum remains nicely overbought with price all contained above the low moving average so this could continue further:
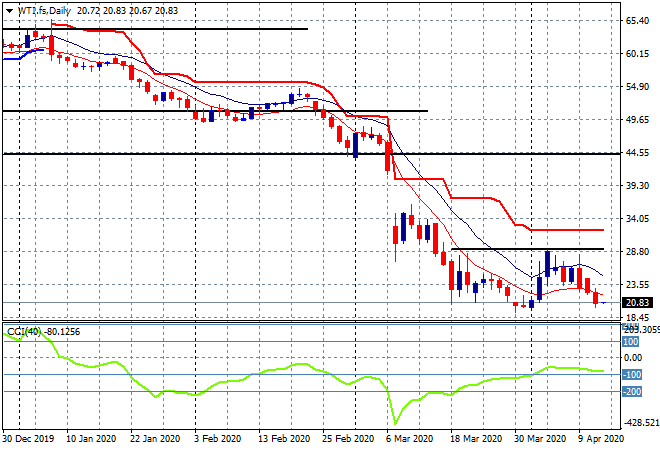
Despite the record cut by OPEC+, oil prices continue to head lower again with WTI falling 8% to be back below the $21USD per barrel. Resistance seems to be key at the $28 level on the daily chart so watch for spluttering and jostling below that level in the weeks to come, where I’m watching a retest of the former lows:
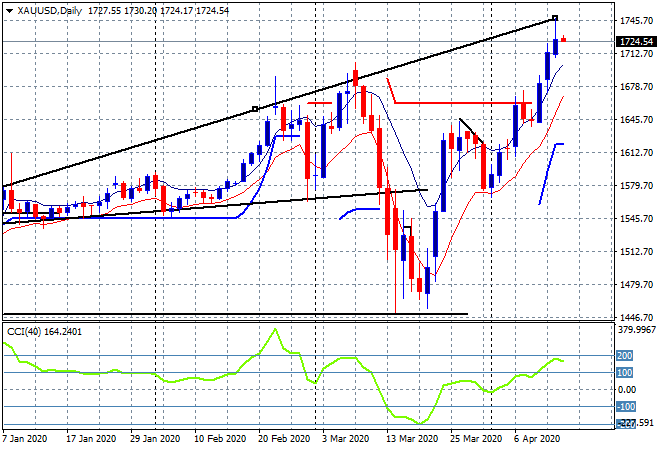
Finally to gold, which after soaring to new heights, exceeding the $1700USD per ounce level is pulling back ever so slightly as momentum remains in a significant overbought condition. The longer term technical picture continues to scream higher but there could be a retracement on profit taking soon as price hits the top of a very wide trend channel:
Glossary of Acronyms and Technical Analysis Terms:
ATR: Average True Range – measures the degree of price volatility averaged over a time period
ATR Support/Resistance: a ratcheting mechanism that follows price below/above a trend, that if breached shows above average volatility
CCI: Commodity Channel Index: a momentum reading that calculates current price away from the statistical mean or “typical” price to indicate overbought (far above the mean) or oversold (far below the mean)
Low/High Moving Average: rolling mean of prices in this case, the low and high for the day/hour which creates a band around the actual price movement
FOMC: Federal Open Market Committee, monthly meeting of Federal Reserve regarding monetary policy (setting interest rates)
BOJ/Abenomics: Bank of Japan, economic policy/direction enacted by PM Shinzo Abe
DOE: US Department of Energy Uncle Point: or stop loss point, a level at which you’ve clearly been wrong on your position, so cry uncle and get out!