The US is now being ravaged by the virus both medically and economically. Goldman sees a Q2 growth apocalypse:
While the exact timing of the medical and economic recovery is highly uncertain and relapses are plausible, our assumption is that stronger lockdown and social distancing measures and perhaps some weather effects reduce new infections sharply over the next month. Combined with potential medical breakthroughs or adaptation by firms and consumers, this slowdown in new infections is likely to lead to a gradual economic recovery. The slow pace of recovery in our forecast even in 2021 allows for longer-lasting scarring effects on businesses and workers
On the one hand, the anecdotal evidence and the sky-high jobless claims numbers show an even bigger output and (especially) labor market collapse than it had anticipated. This not only means deeper negatives in the very near term but also raises the specter of more adverse second-round effects on income and spending a bit further down the road.
On the other hand, both monetary and fiscal policy are easing dramatically further, which will tend to contain these second-round effects and add to growth down the road. The Phase 3 fiscal package was much bigger than we had expected, we now anticipate a Phase 4 package focused on state fiscal aid, and the Fed is likely to use the $454bn addition to the Treasury’s Exchange Stabilization Fund aggressively to sustain the flow of credit to private-sector and municipal borrowers.
Press reports citing state officials indicate that claims rose dramatically from March 15-21 to 22-28 in California and Texas. Our analysis of anecdotal press reports for the 15 most populated states suggests a significant increase in total claims during March 22-28, in part because many states experienced application bottlenecks in the first week and in part because stay-at-home orders likely had a greater effect in the second week.
We expect claims to remain very elevated—likely over 2mn—for at least another week (March 29-April 4) and somewhat elevated after that. Widespread reports of application bottlenecks suggest that many laid off workers have yet to file. Some employers, especially in the retail sector, are taking a staggered approach to layoffs. And many business owners and workers are just beginning to learn about the more generous unemployment insurance benefits—which will exceed normal wages for many workers—and the expansion of coverage included in the Phase 3 legislation. In total, we expect over 11mn claims to be filed in the first three weeks of the coronacrisis and at least a couple million more in the rest of April.
…Using the labor market data in this fashion requires an estimate of “Okun’s law”, the relationship between the change in the unemployment rate and the change in real GDP (relative to trend). Normally, the coefficient for Okun’s law is thought to be about 2, meaning that a 1pp rise in the unemployment corresponds to a 2% hit to real GDP. During this crisis, however, a more appropriate Okun’s law coefficient is likely to be closer to 1.
Our current estimate of a roughly 12pp increase in the unemployment rate implies a roughly 12% peak decline in the level of GDP, which is broadly consistent with the estimates in Exhibits 1 and 2. Going forward, we plan to use this relationship and its industry-level counterparts aggressively to keep our GDP estimates up to date in coming months as more timely labor market data become available. This could well imply further substantial revisions to our real GDP estimates—in either direction—as the scale of the labor market downturn comes into fuller view in coming weeks and months.
Advertisement
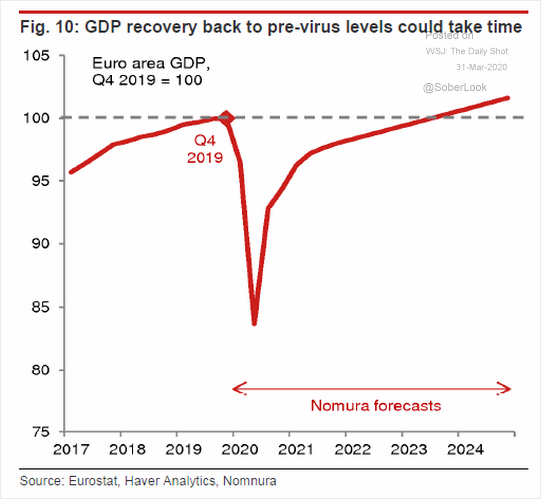
The V-shaped recovery story is bull except to the extent that it sees the economy bouncing off zero. Nomura has a better chart for how this will likely play out, for Europe:
In short, output will return to pre-virus levels over three years.
Advertisement
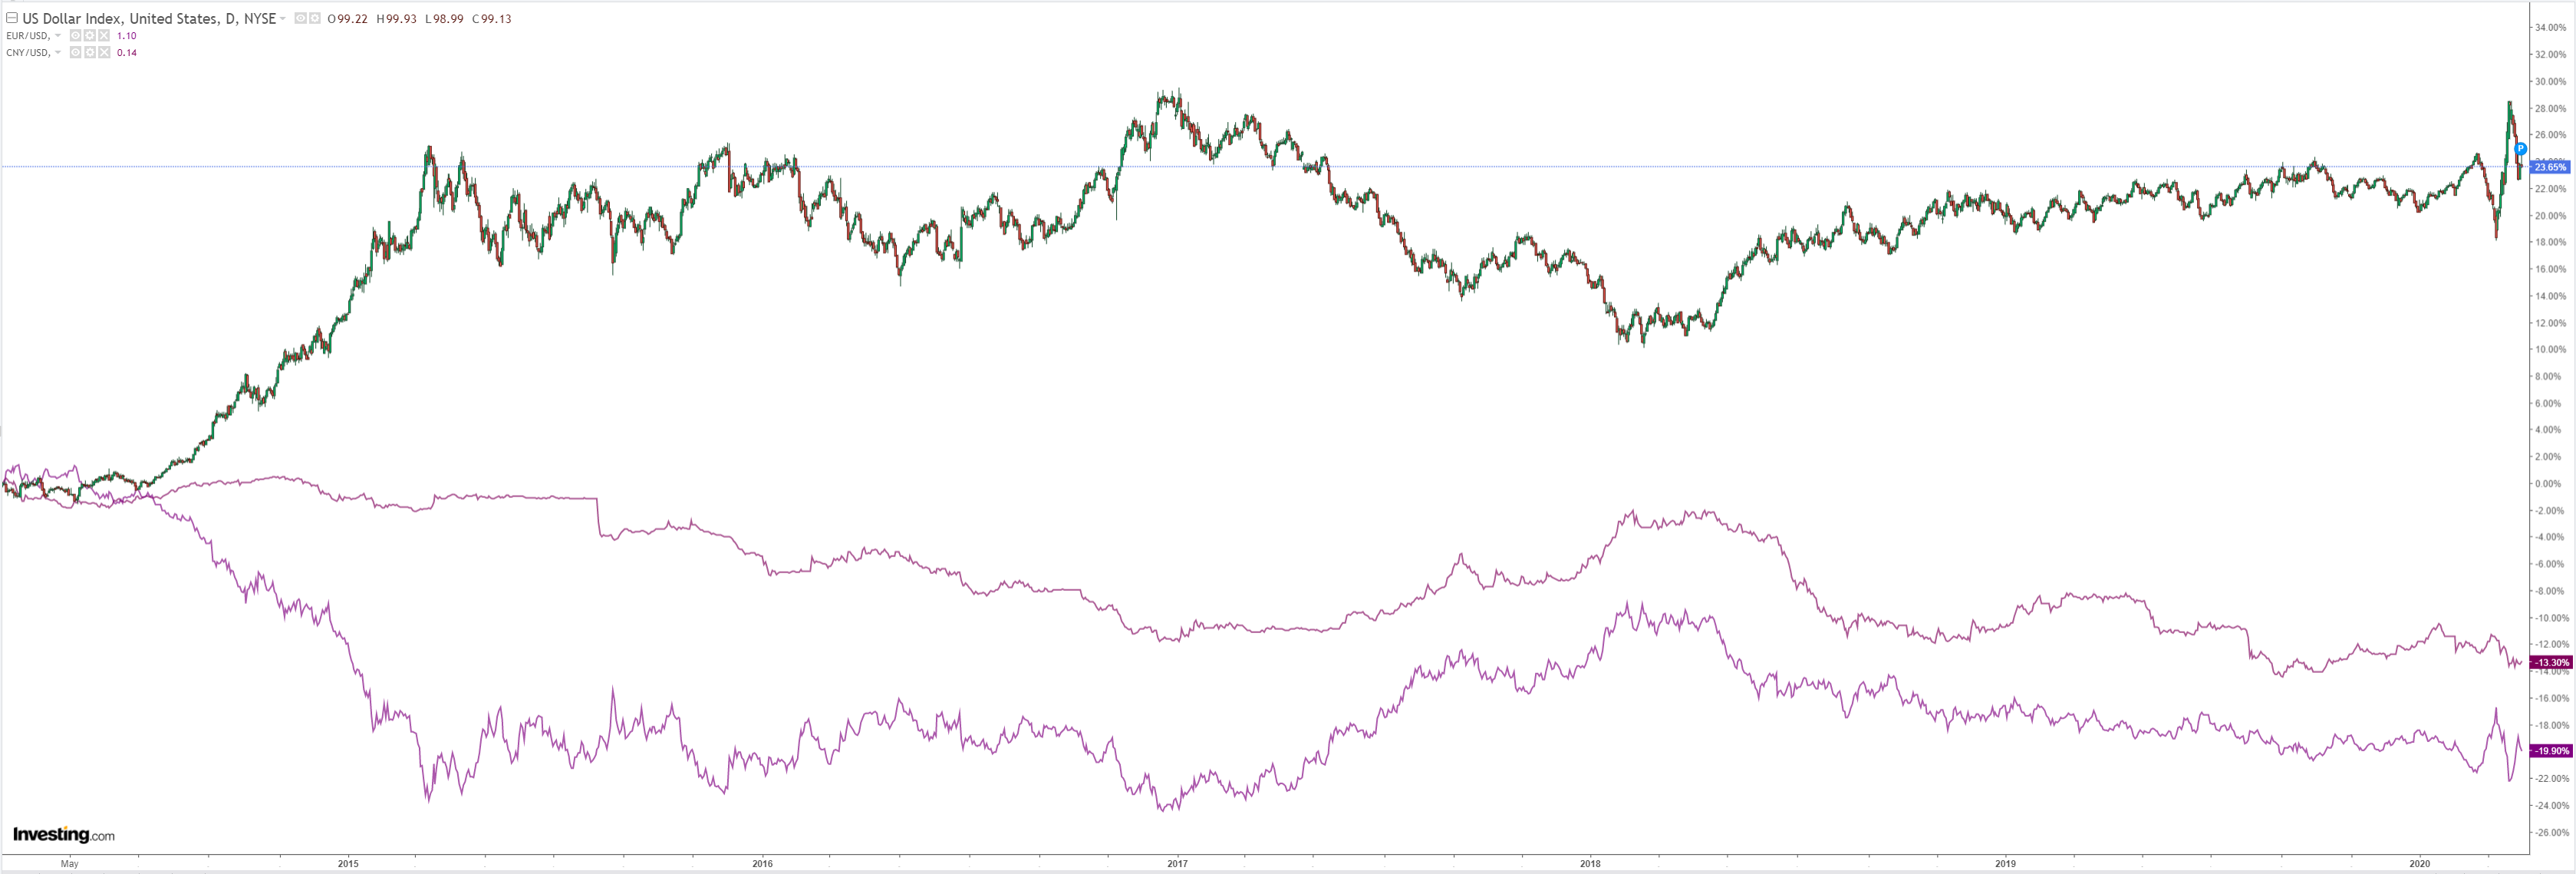
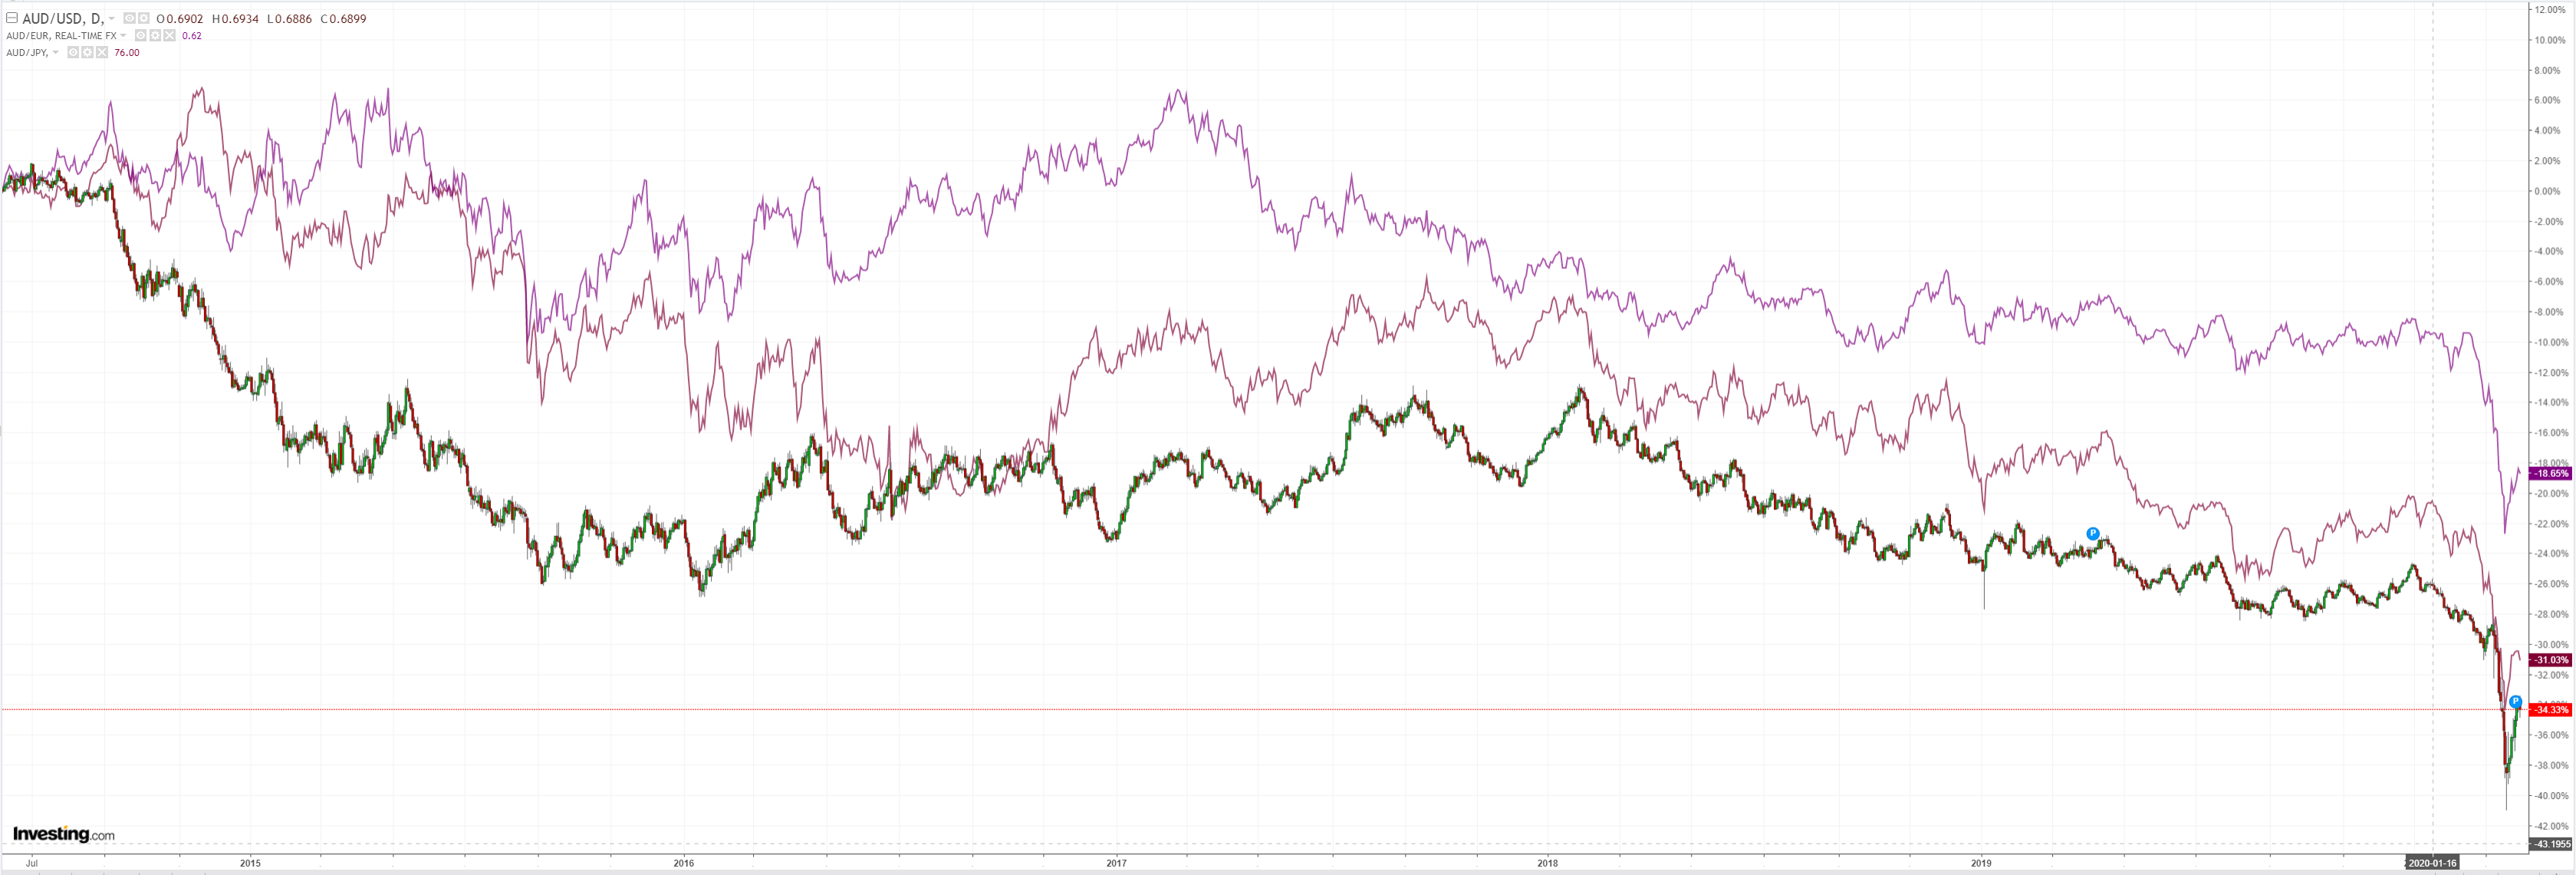
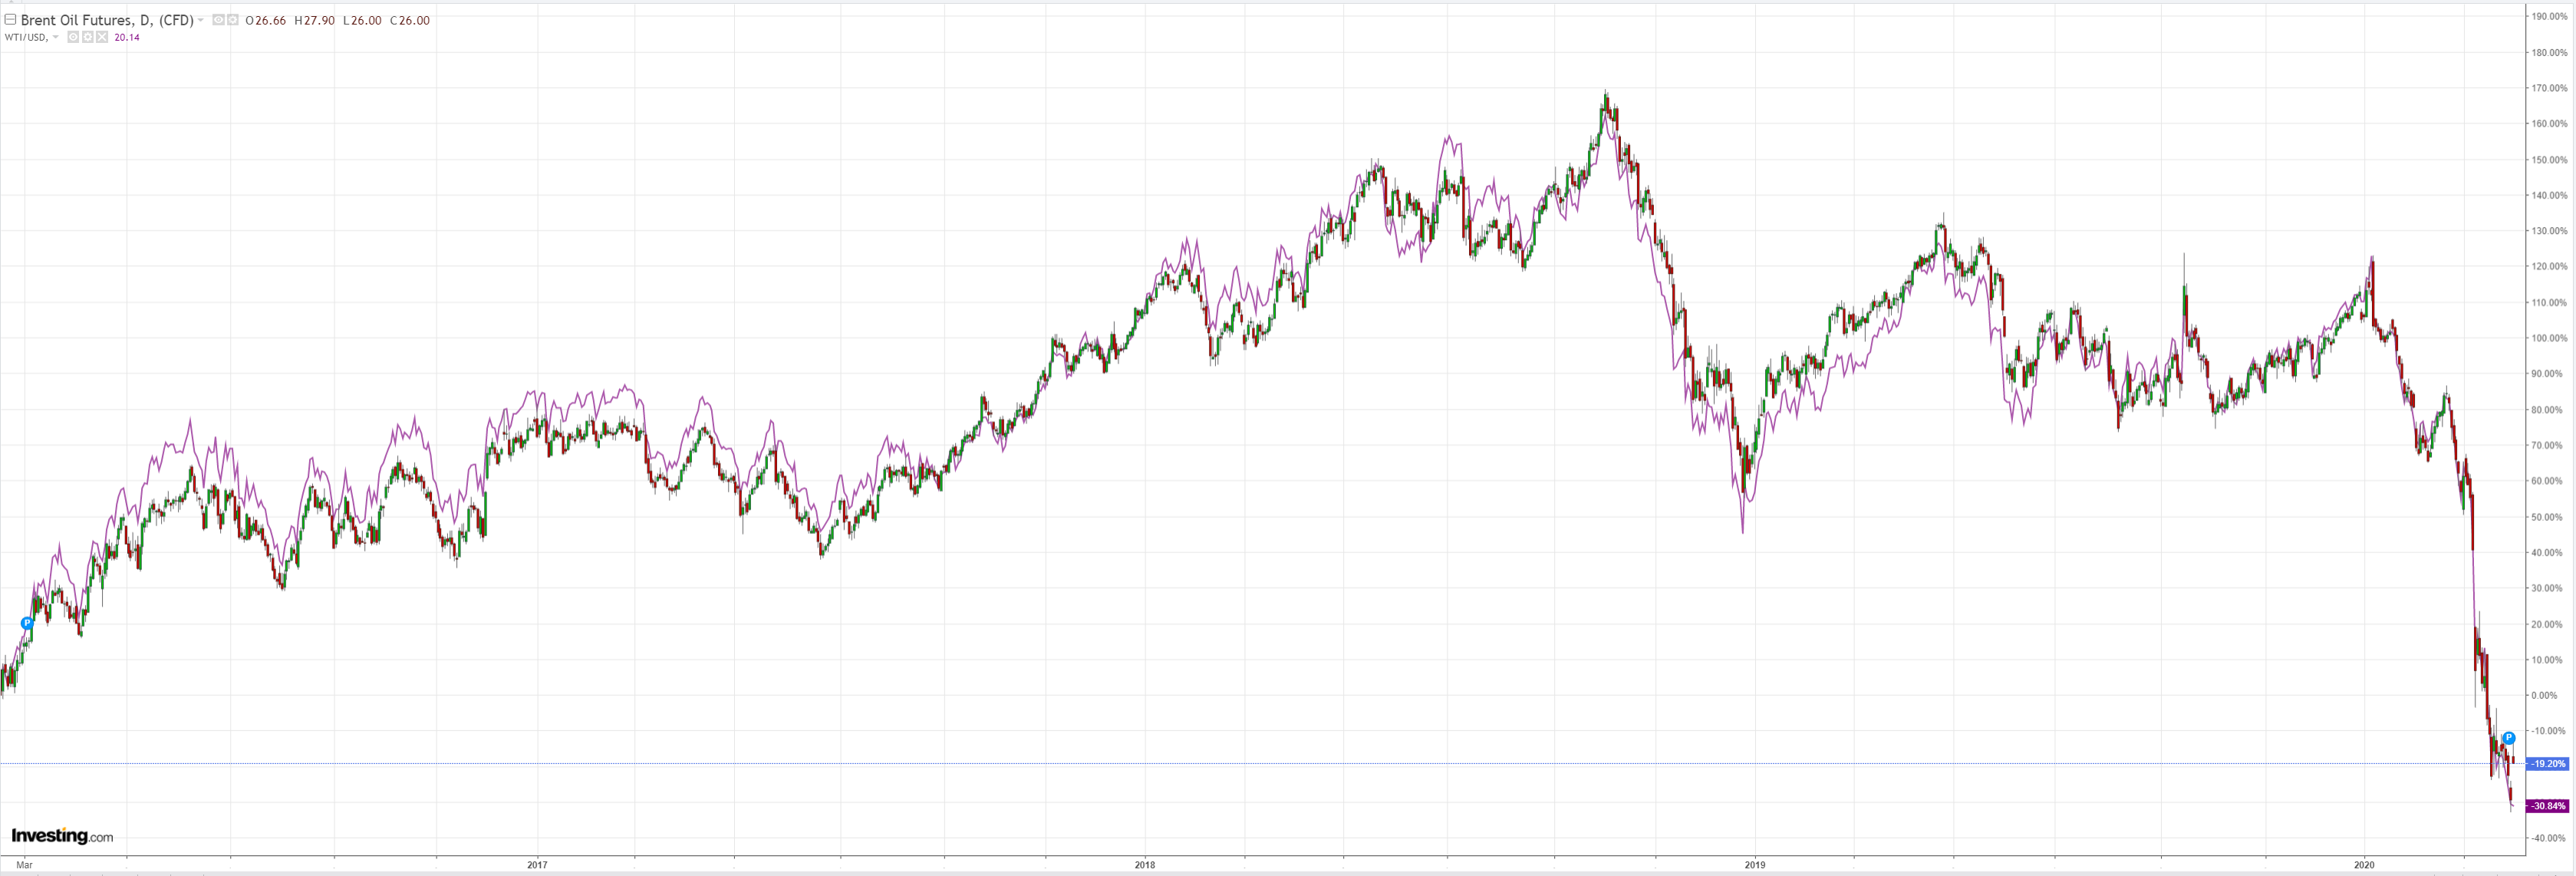
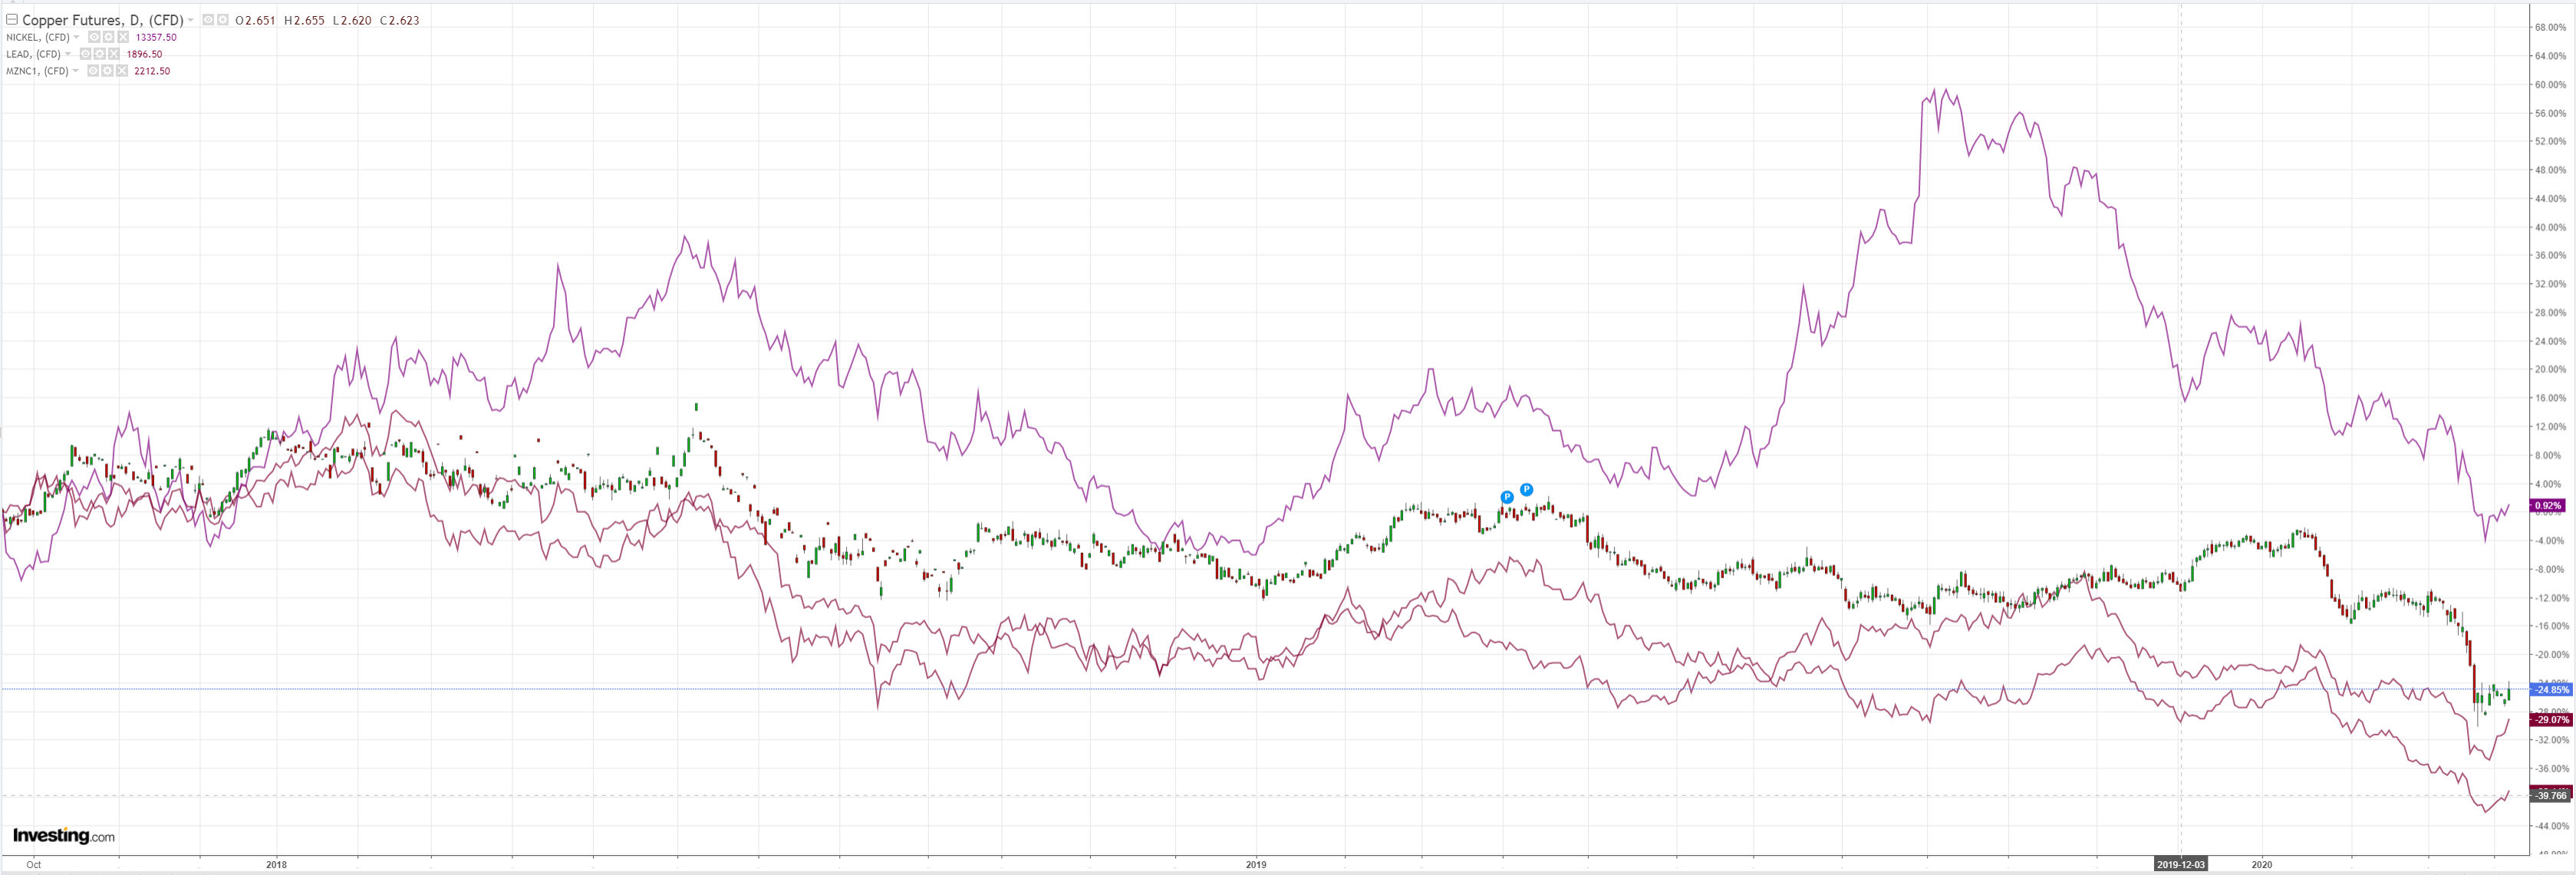
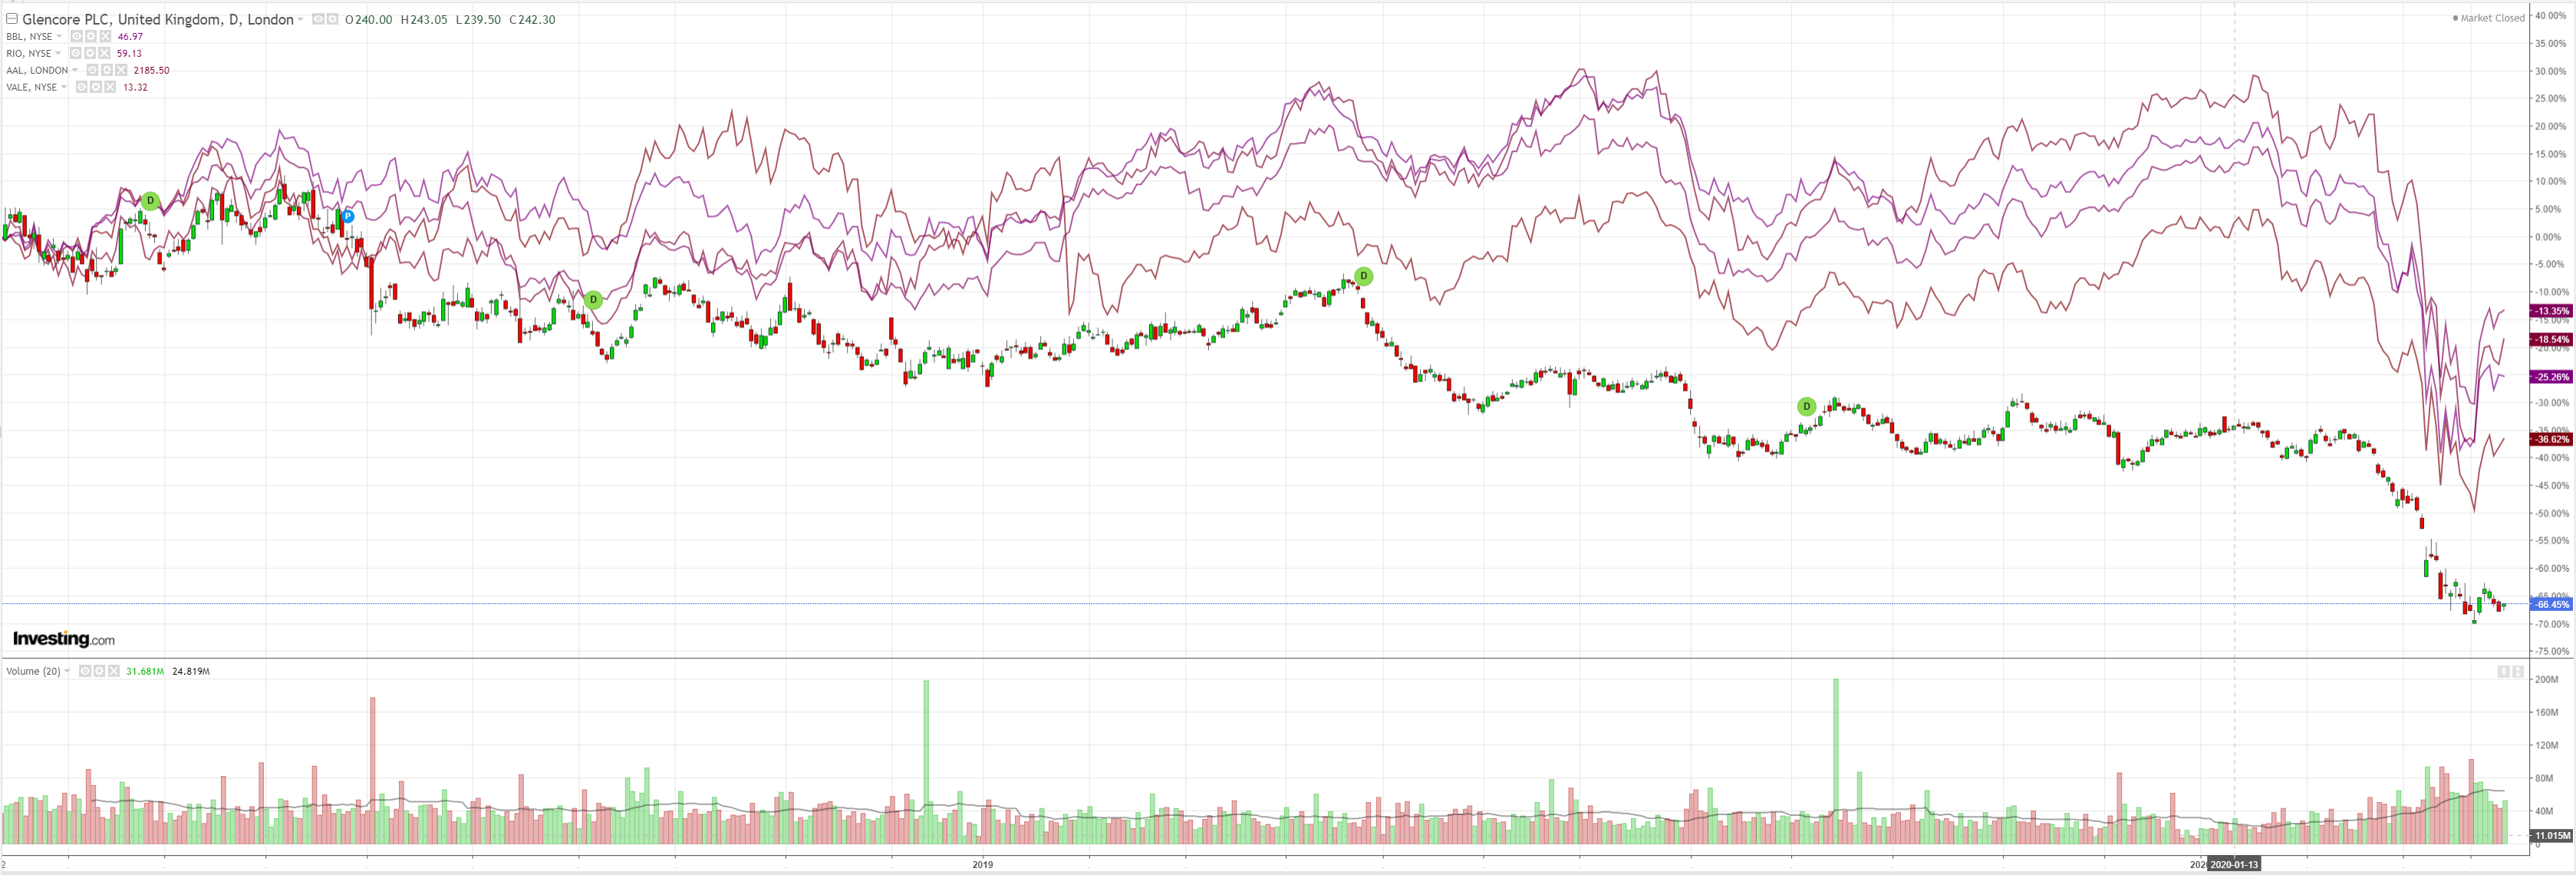
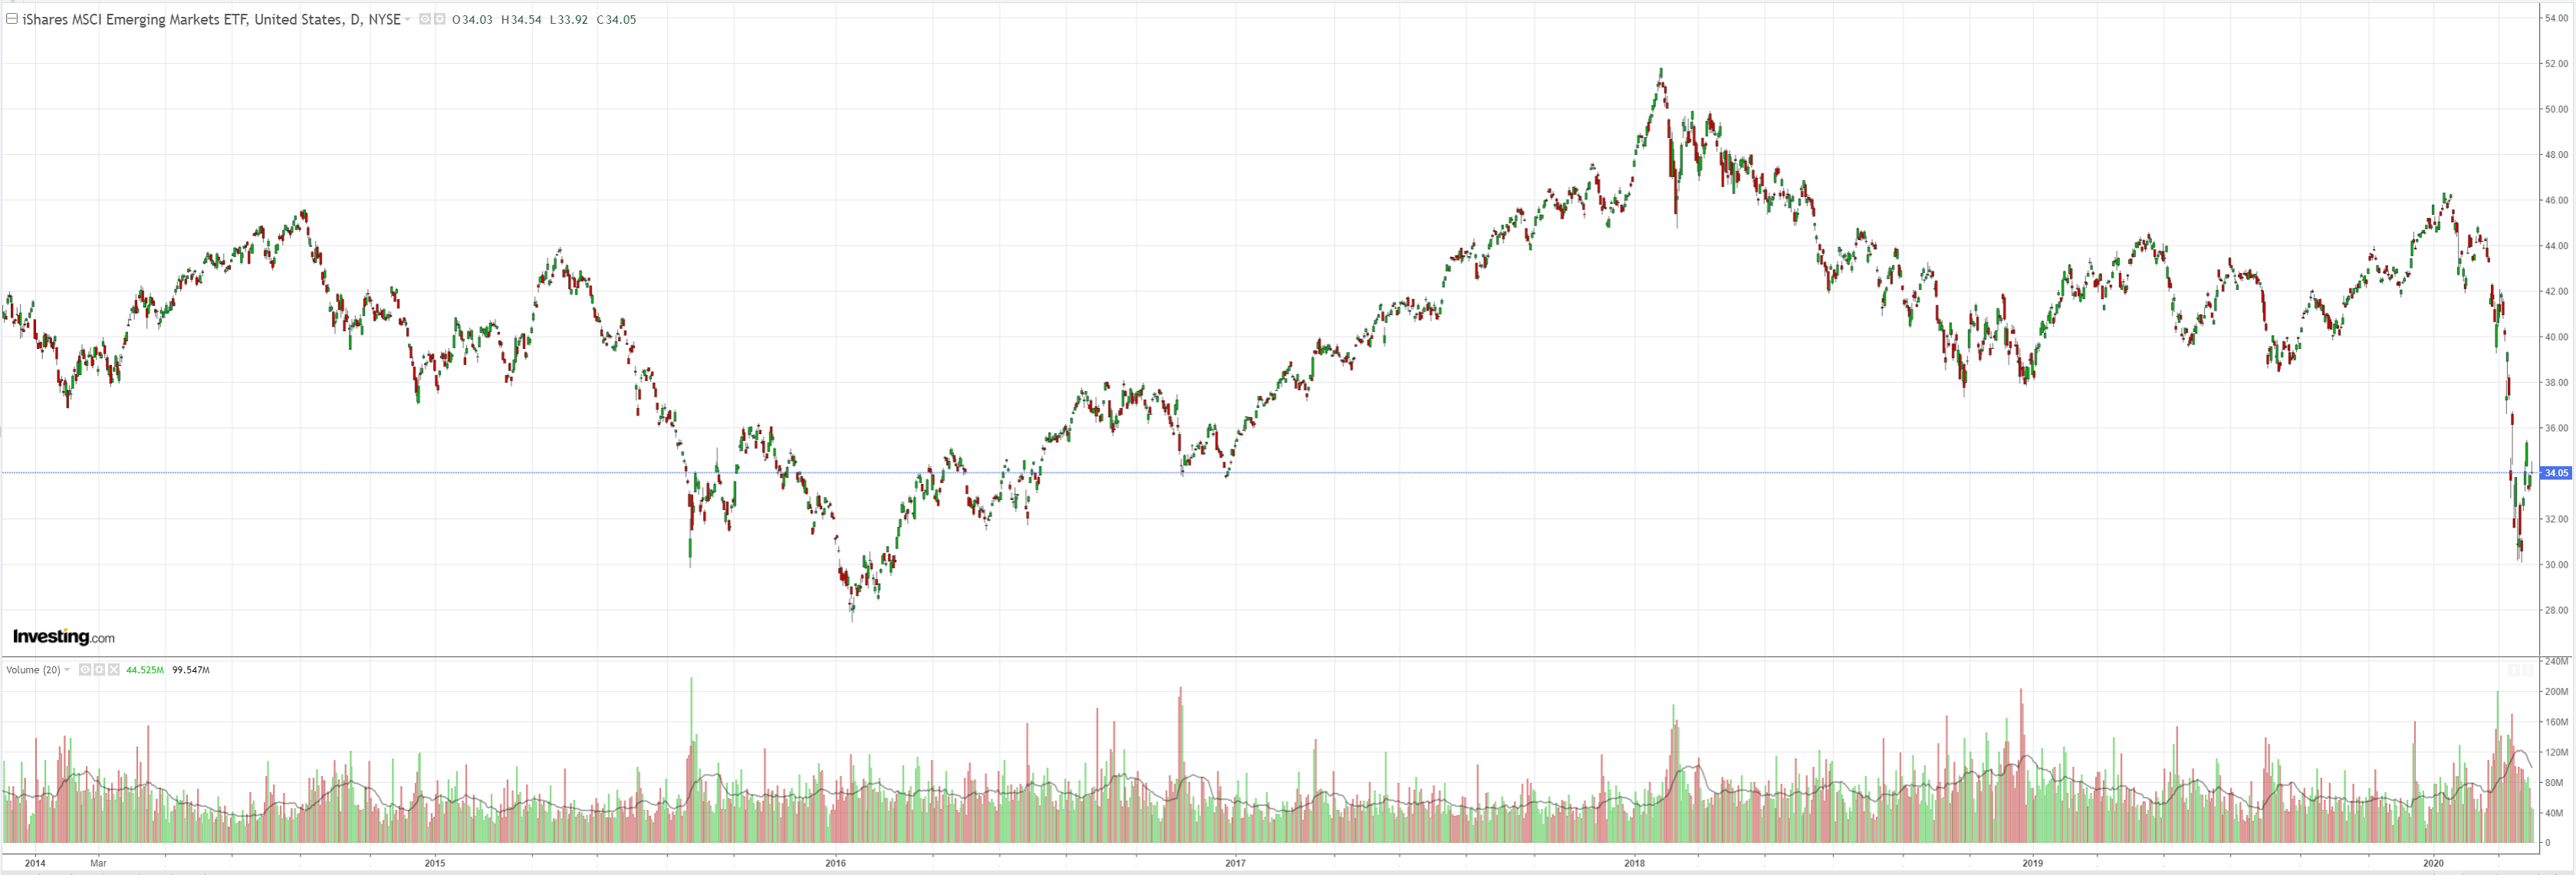
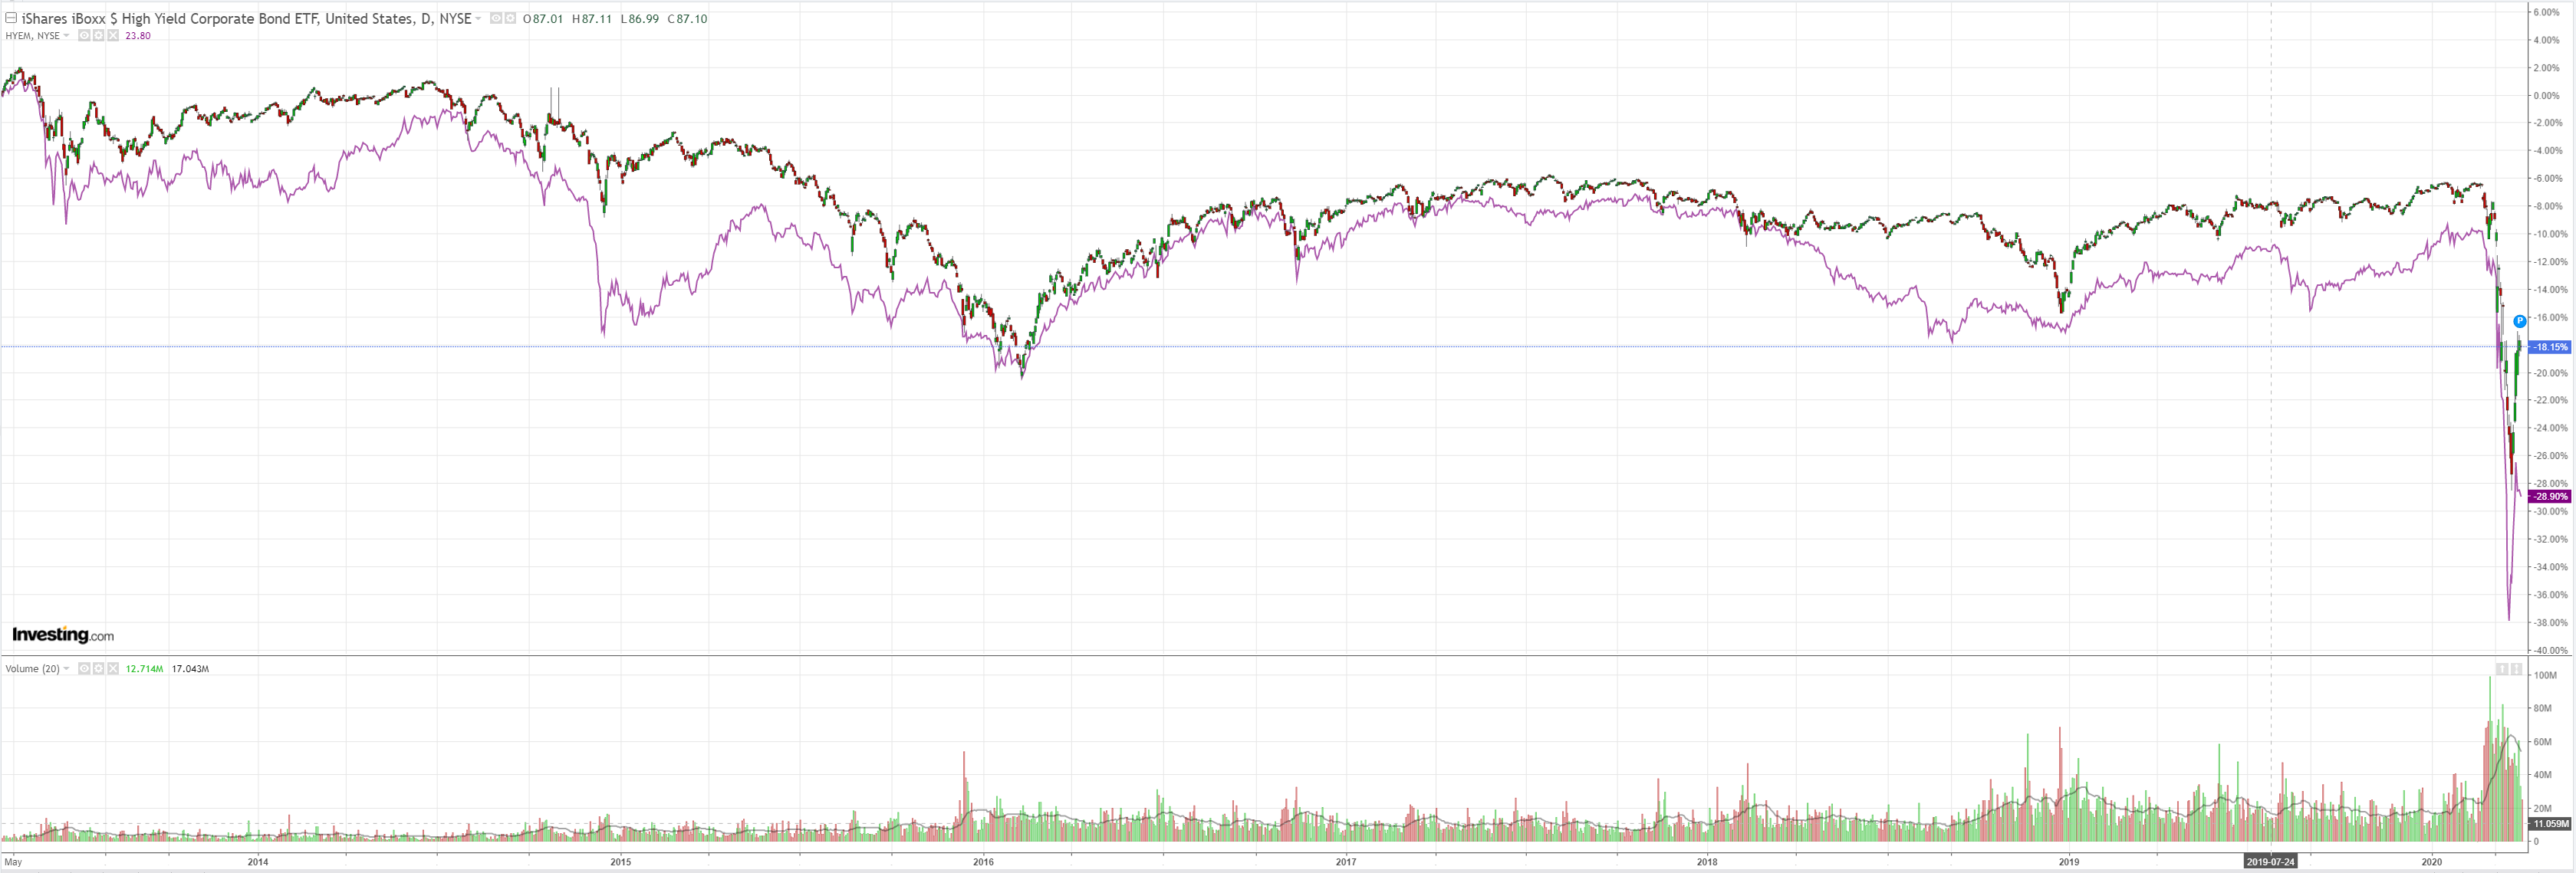
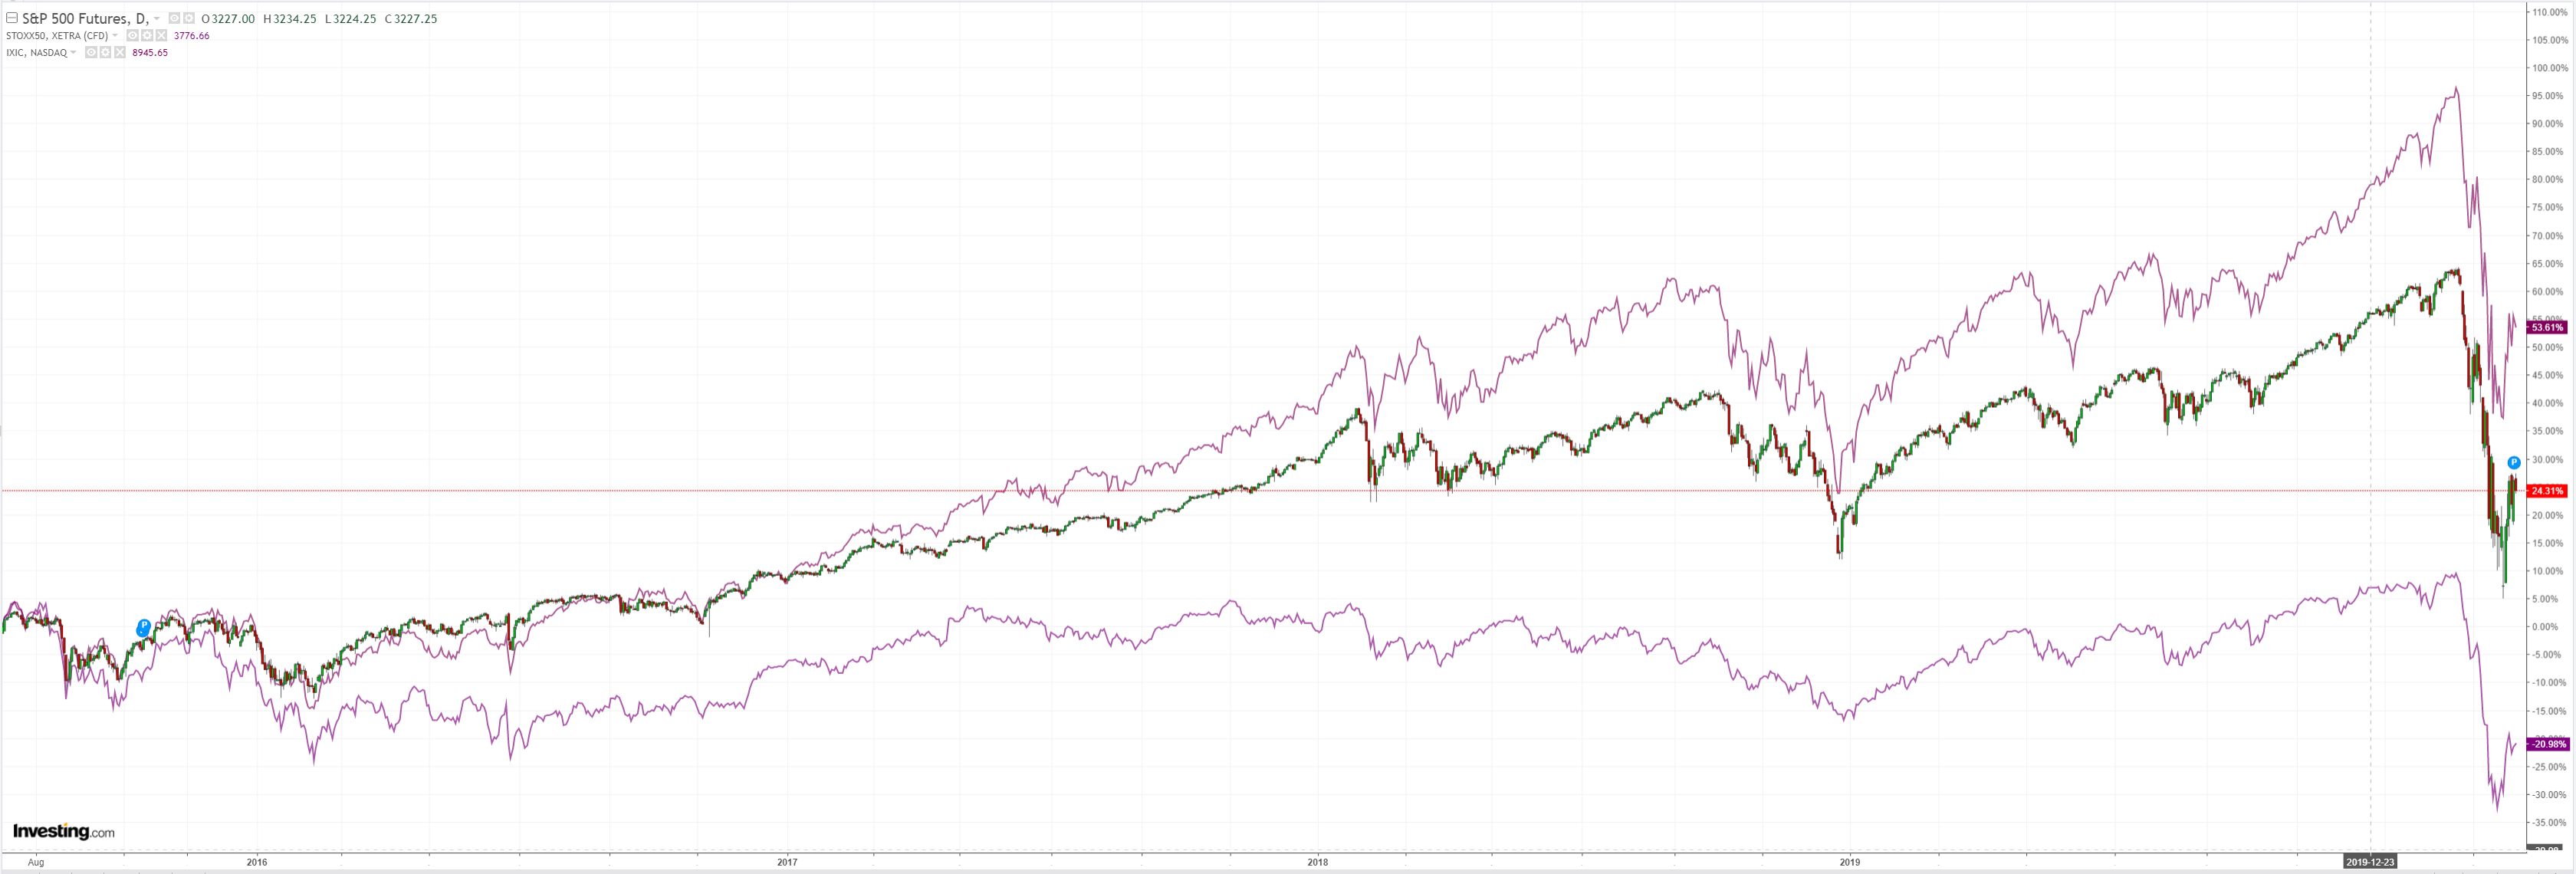
I still see a major US corproate debt shakeout based upon this, a strong greenback, and a much lower Australian dollar.
David Llewellyn-Smith is Chief Strategist at the MB Fund and MB Super. David is the founding publisher and editor of MacroBusiness and was the founding publisher and global economy editor of The Diplomat, the Asia Pacific’s leading geo-politics and economics portal.
He is also a former gold trader and economic commentator at The Sydney Morning Herald, The Age, the ABC and Business Spectator. He is the co-author of The Great Crash of 2008 with Ross Garnaut and was the editor of the second Garnaut Climate Change Review.