Katherine Betts, Adjunct Associate Professor at Swinburne University, has published a new report for the Australian Population Research Institute (APRI) examining whether demographic ageing is the “demographic time-bomb” commonly claimed by economists, policy makers and population boosters.
Below is the executive summary, along with key charts and data:
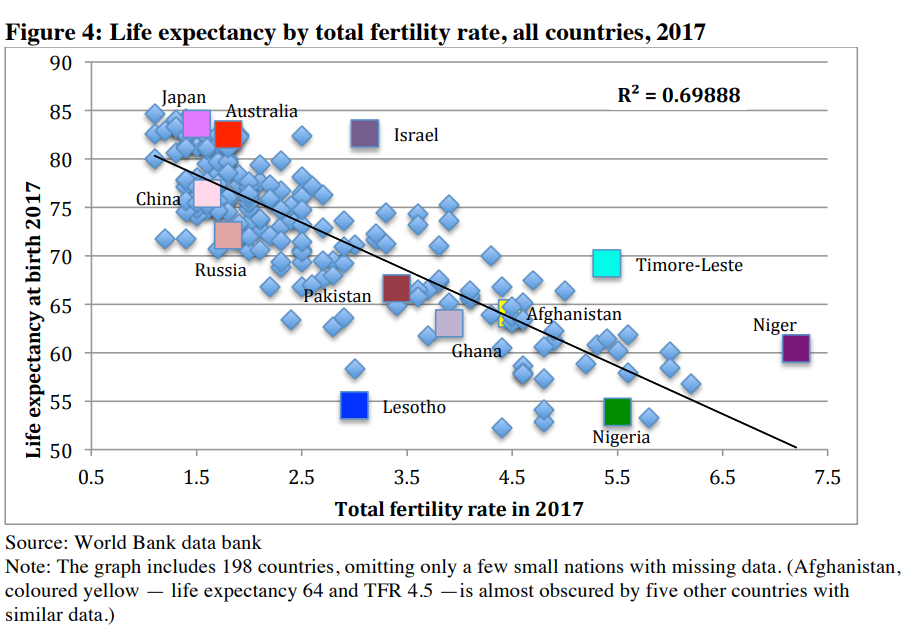
Some commentators see demographic ageing as a problem, even a threat. For example Josh Frydenberg writes that ‘With the sixth highest life expectancy in the world’, ageing in Australia ‘will place new demands on our health, aged care and pension systems’. He focuses on the relative decline of people of conventional working age compared to those aged 65 and over, warning that ‘over the next four decades [the ratio will] fall to just 2.7 to 1’. For him this is ‘an economic time-bomb’.
He is not alone. For example, Bernard Salt calls the prospective maturity a ‘demography induced fiscal calamity’ and says that voters need to be scared. Those ‘who pretend there is no intergenerational fiscal sustainability risk are demographic deniers’.
But is increasing demographic maturity a threat or is it a sign of progress? And are the changes that come with it manageable, even beneficial?
The Malthusian trap
For millennia Malthusian pressures kept population growth in check. Many children were born but scarcity and disease meant few lived to grow old. High birth rates and high death rates kept populations young and (from our perspective) miserable. This was the Malthusian trap, the old demographic equilibrium. But in the last 200 years most human populations have escaped from it.
Scientific advances led to better sanitation, cleaner water, improved transport, more food, more health care and better education. These changes brought with them lower infant mortality and longer lives which, in turn, boosted productivity.
The longevity dividend
In the wake of these changes adults no longer had to spend most of their short lives bearing children and trying to raise them. They now had more years and more time to do other things, including learning new skills and taking on paid work. Longevity delivered a social and economic dividend.
As more of their children lived to grow up, many parents moderated their family size. They would not have been able to see a statistical overview of the effects of their decisions. But if they had they may well have thought that fewer, but healthier, children were worth the cost of more surviving grandparents, if indeed this was a cost.
Australia’s escape into the virtuous circle of longevity and productivity
Like all economically advanced societies, Australia has long ago escaped the Malthusian trap of early death and stagnant living standards.
The average (median) age of Australia’s population has been rising since at least 1901. Longer lives can increase workers’ productivity as the education and experience of mature people is drawn on for longer periods than before. Material progress leads to an older population and this in turn may promote more material progress.
Though there are sceptics, the potential is there for a virtuous circle.
The inevitability of demographic maturity
Barring a catastrophe that pitches us back into the Middle Ages, demographic maturity is inevitable.
The only way for a society to achieve a stable population with a permanently youthful age structure is for many children to be born and for many people to die young. Unless we want to return to this old equilibrium some increase in the relative size of older age groups must occur.
But this new equilibrium does mean social change. We are moving into new territory and it is understandable that there should be debate about its consequences.
This debate is the focus of this paper. Are the changes manageable? Will Australia with an older population be worse off or better off, and in what respects?
Findings
As well as ageing Australia’s population has been growing rapidly. The estimated resident population grew by an annual average of 1.7 percent from June 2007 to June 2019, adding 4.5 million extra people. This took us to a total population of 25.4 million in 2019. The average contribution of net overseas migration (NOM) to this increase was 59 percent. In the last three years (June 2017 to June 2019) it was 63 percent.
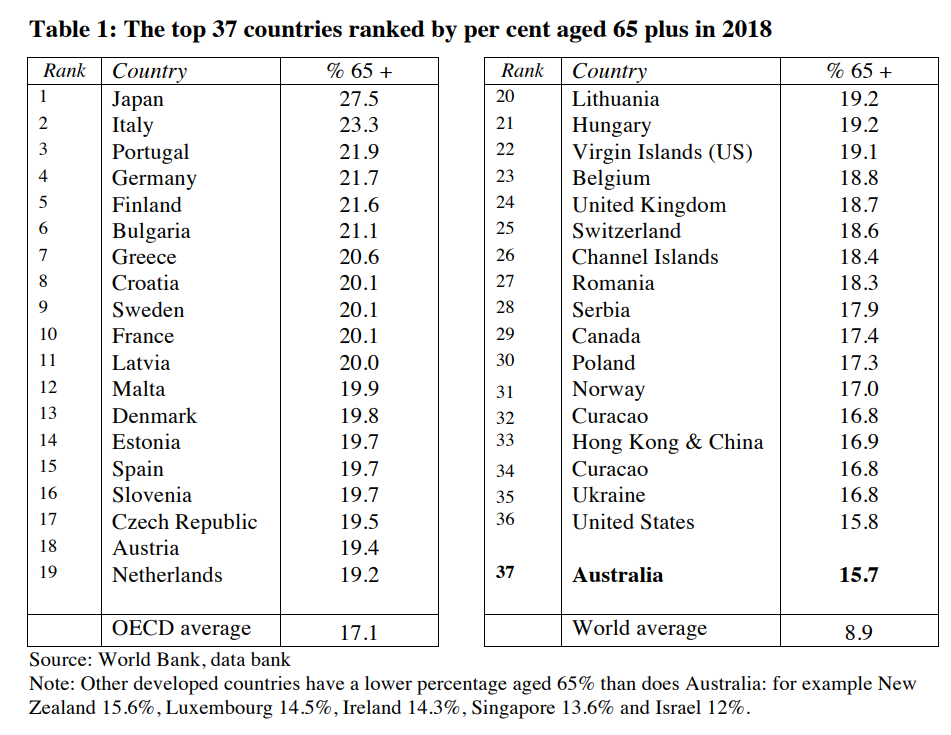
In 2020, Australia’s share of people aged 65 plus reached 16 per cent. This is well below the level in most other wealthy societies, including Sweden where it is 20.1 percent, Germany 21.7 percent and Japan 27.5 percent. All three are coping well, including Japan. Will Australia be able to do so too?
The proportion elderly need not increase indefinitely. For example, with support for the two-child family and nil net migration our proportion aged 65 plus would stabilise at around 28 percent in 2066 and remain at that level.
Health
Certainly a higher proportion of older people means that the numbers of frail elderly will increase. But Section 2 shows that rates of healthy life expectancy are increasing. In the 12 years between 2003 and 2015 males gained 3.9 years of healthy life expectancy and lost 1.2 years of living with disability. In the same short period females gained three years of healthy life expectancy and lost 1.3 years of disability.
Rates of severe and profound disability among older Australians are falling. This means that while there will be more older people in 2066, they will be fitter than they have been even in the recent past.
This trend towards higher levels of fitness can be seen in the positive contribution older Australians make to others through volunteering and caring for grandchildren. At the 2016 census 73,562 children lived with their grandparents who acted as primary carers. And from June 1999 to June 2017 between 22% and 30% of children aged 0-4 were cared for by grandparents as were 13% to 16% of children aged 5-11.
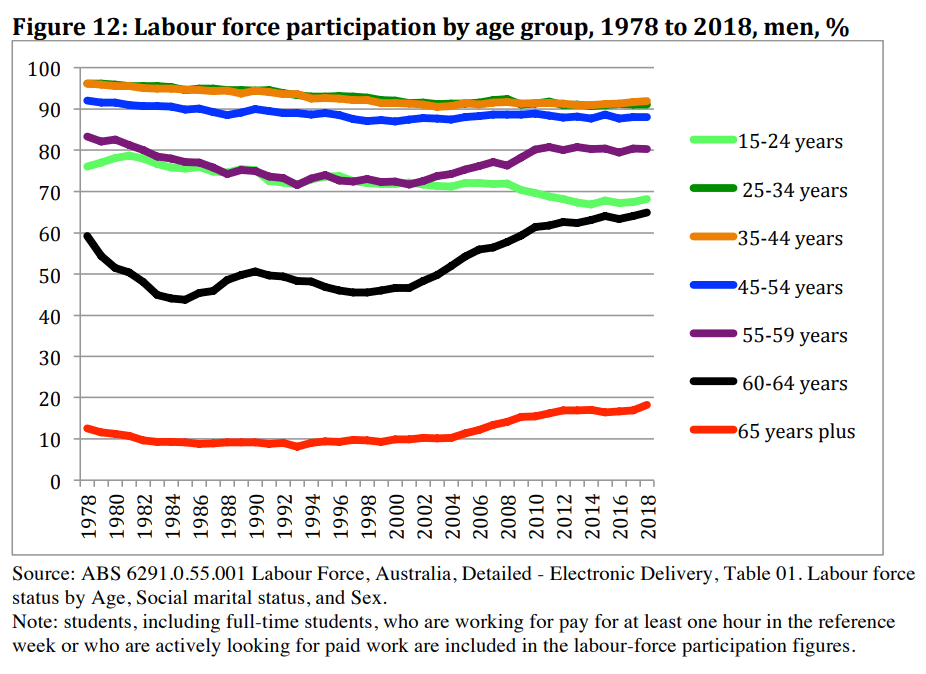
Older people’s higher level of fitness is also reflected in the labour-force.
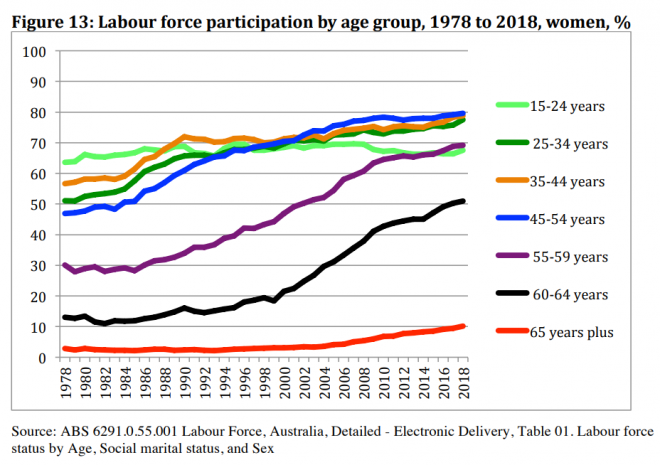
The labour force
Section 3 shows that older people’s participation in the labour force is growing, especially among older women. For example, in 1978 13.1% of women aged 60-64 were in the labour force. By 2018 the figure had nearly quadrupled to 50.9%.
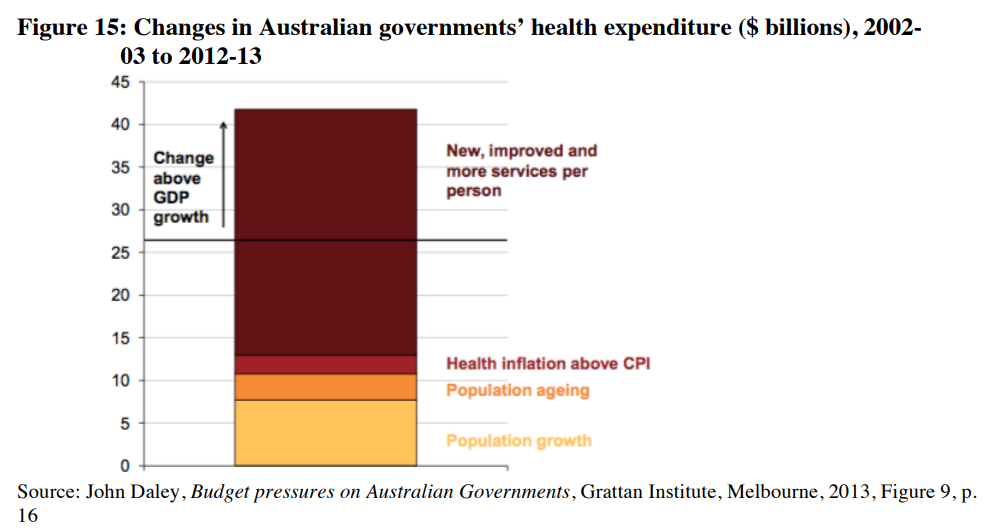
Costs—health care
Section 4 shows that health-care costs are rising. But it also shows that this is mostly due to more medical services being provided per person in all age-groups, and to overall population growth. Demographic ageing plays but a minor role.
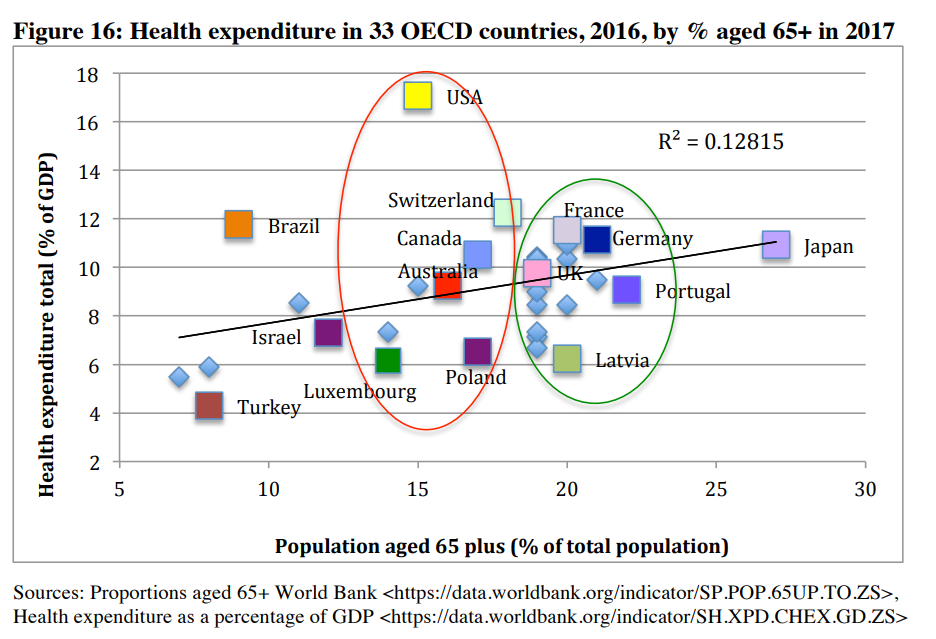
Comparisons with other OECD countries show that the way in which health care is provided has a more dramatic effect on health-care costs than does the proportion elderly. Japan, with the world’s oldest population, has moderate health care costs. In contrast, the United States, with a median age only slightly higher than Australia’s, has the highest health expenditure per capita by a wide margin.
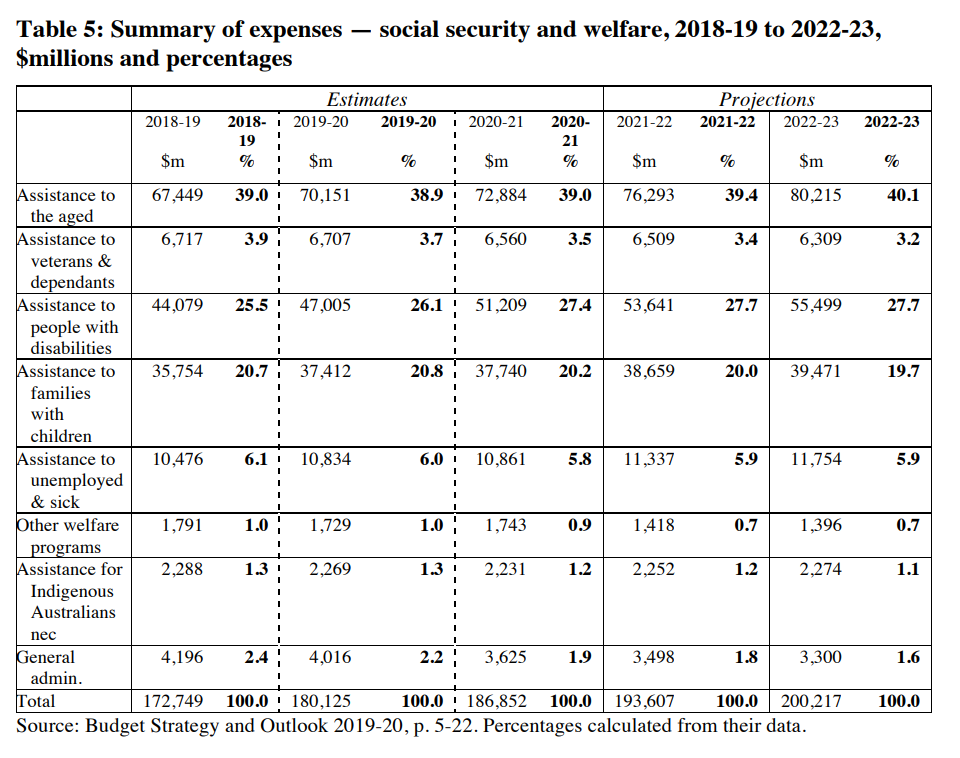
Costs—social welfare: aged care and age pensions
Section 4 also shows that in June 2018 only 6% of Australians aged 65 plus were in permanent residential aged care. Even for the group aged 90 plus only 44.6% were in care.
Assistance to the aged (residential aged care and age pensions combined) accounted for 38.9% of the welfare budget in 2019-20, a proportion that is estimated to rise to 40.1% in 2022-23.
The Parliamentary Budget Office (PBO) assumes that over the decade from 2018-19 to 2028-29 costs will rise by $36 billion because spending on age care and pensions will rise (by $16 billion) and a smaller proportion of the population will be in paid work (depleting tax revenue by $20 billion). But it also assumes that population growth and income growth will increase tax revenue by around $187 billion resulting in a net increase by 2028-29 of around $166 billion.
The PBO assumes that the population growth will be fuelled by a net migration rate of 225,000 a year. But if this number should be trimmed the loss in tax revenue would be more than offset by lower annual spending on infrastructure. In any event assistance to the aged will not bankrupt us.
Sources of revenue
Section 5 shows that, over the nine years from 2008-09 to 2017-18, total tax revenue for all three levels of government increased by an annual rate of 5.11% (while the annual rate of inflation was 2.2%). It also shows that, in 2017-18, only 36.7% of revenue came from personal income tax. While this includes taxes on salaries and wages it also includes taxes on allowances, dividends, interest, capital gains, business income, pensions, rents, royalties, partnership income, and distributions from trusts, all of which are independent of age.
Data from the Australian Taxation Office for 2013-14 indicate that 75.3% of personal income tax comes from salaries and wages. If this holds for 2017-18 only some 28% of total tax revenue would derive from taxes on paid work.
Pessimists often assume that government’s only source of revenue is personal income tax levied on paid work. This is far from being the case.
Productivity
Section 6 reports on research findings that population ageing does not detract from workers’ productivity. Older people in paid work are often no less productive than younger workers and, in some instances, more productive. A number of researchers find a positive effect of demographic ageing on labour productivity and now talk of the longevity dividend in productivity per worker.
However, it is true that over time as the population ages, the ratio of people in their retirement years to those of prime working age will increase. Other things being equal population ageing will eventually slow the rate of economic output per capita.
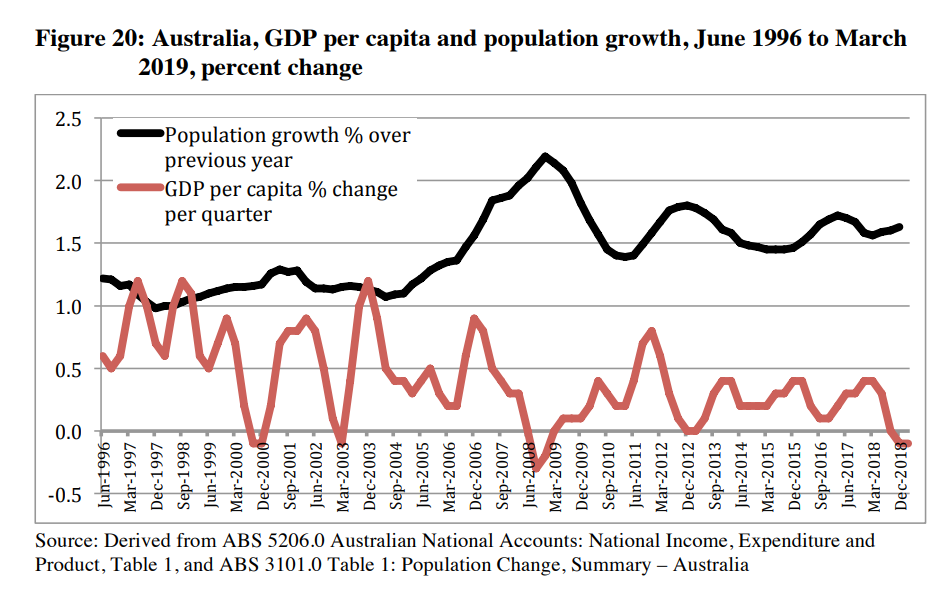
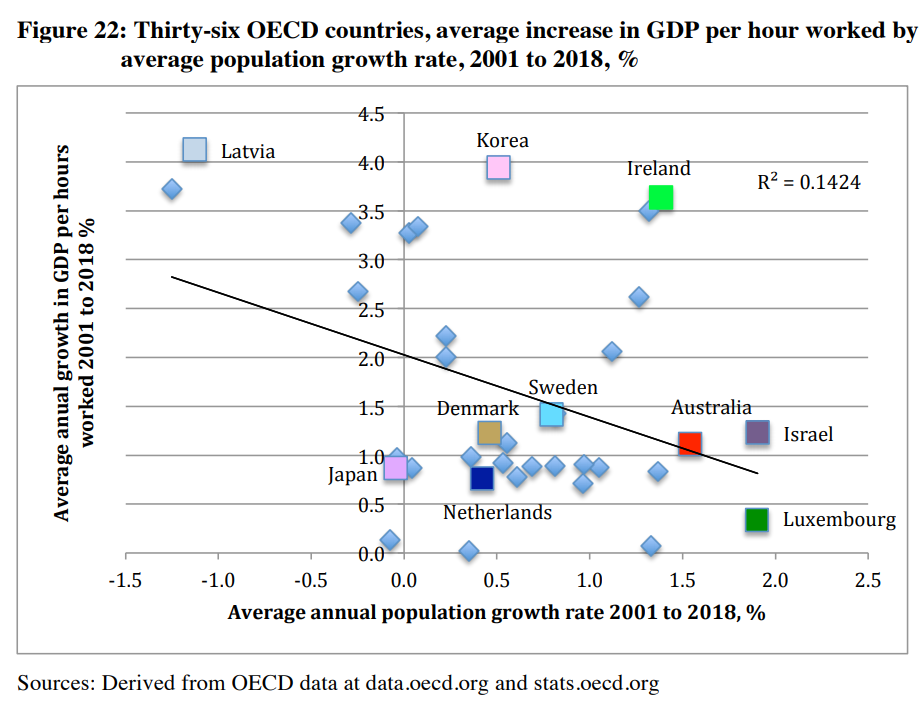
The effects of population growth are different. Here there is a negative association with productivity in Australia and in 36 OECD countries right now. High rates of population growth are currently linked with lower levels of growth in GDP per capita and with lower levels of growth in GDP per hour worked.
In Australia’s case population growth appears to be a drag on growth in productivity. Of course we have lost of much of our manufacturing industry, where productivity gains are most easily achieved. But apart from this, sluggish productivity derives from congestion and from the fact that much of our capital is being invested in city building and home building. This means capital widening rather than capital deepening.
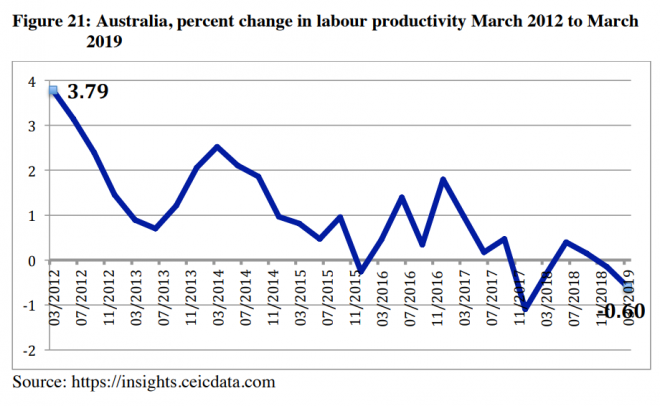
Labour productivity grew by 1.5 per cent per year in Australia from 1974-75 to 2018-19. But this is a long-term average. It actually fell to minus 0.2 per cent in 2018-19.
At some time in the future growth in productivity may well be lower than it might have been with a constant proportion of conventional working wage. But productivity is falling now when the effects of ageing are negligible but the effects of numerical growth considerable.
Infrastructure costs
Rapid population growth of the kind seen since 2007 leads to productivity-sapping congestion. It also promotes investment in housing and additional infrastructure. This duplicates existing capital rather then enhancing it. Both congestion and capital widening lead to diseconomies of scale.
In 2013 the Productivity Commission wrote that, with the then current rate of population growth, public and private investment would have to grow by five times the amount over the next 50 years as it had in the previous 50 years. There has been substantial investment in infrastructure recently but not at this level, and not at a level high enough to keep up with population growth.
Jane O’Sullivan estimates the infrastructure costs of settling one new immigrant at $100,000. In 2018-19 net overseas migration was 244,000, implying an infrastructure bill of $24.4 billion for that year alone, and this is without including the 143,000 infants added to the population by natural increase.
The PBO estimates ageing will deplete tax revenue by $36 billion over the next decade, but expects the extra immigration numbers per year it assumes are needed to avert this ‘loss’ will offset much of expected tax loss. Given that it is assuming net migration of 225,000 per year, during this ten-year period the infrastructure costs of this alone could total $244 billion. These costs are not made clear in the PBO’s calculations.
Ageing and the immigration fix
Many policy makers and interest groups argue not only that demographic ageing is a social ill but that it can be ameliorated (if not cured) by high numbers of younger immigrants. Some voters share these concerns about ageing and thus are liable to believe in the proposed treatment.
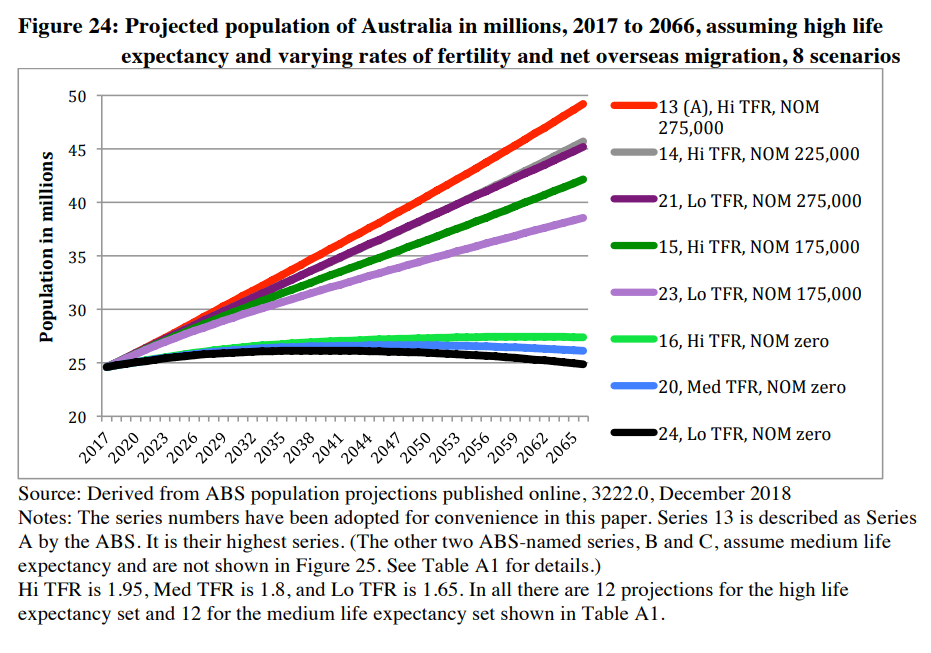
Section 7 focuses on an analysis of the population projections published by the Australian Bureau of Statistics (ABS) in November 2018. This allows a test of immigration’s efficacy as a promoter of youthfulness.
The projections show that very high migration, net overseas migration (NOM) of 275,000 per year (combined with high life expectancy and a total fertility rate of 1.95), leads to a population of 49.2 million in 2066.
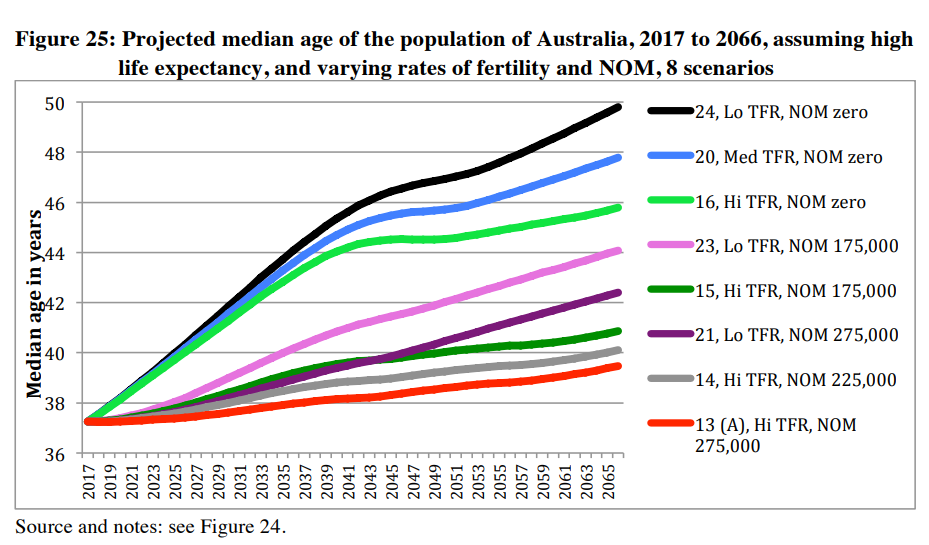
This projection would result in a median age by 2066 of 29.5 years, 6.3 years younger than a projection with similar assumptions about life expectancy and fertility but with nil net migration. (This second projection leads to a population of 27.4 million in 2066 with a median age of 45.8 years.)
The ABS assumption of a NOM of 275,000 per year is not unrealistically high. It is almost exactly the level Treasury is planning for.
Simple subtraction shows that these extra years of youthfulness come at the cost of adding an extra 21.8 million people. This means nearly 3.5 million extra people for every extra year of youthfulness (more than two and a half times the current population of Adelaide).
Section 7 also confirms findings made by Peter McDonald and Rebecca Kippen in 1999. Some immigration reduces the median age a bit, more immigration reduces it relatively less, more immigration less again. The law of diminishing returns sets in.
Moreover, this gain in youthfulness would only be temporary. No matter how young they are on arrival migrants grow old too. As no population can grow for ever, at some time in the future the older age structure would be waiting for us. But with very many more people, including many more older people.
The projections show that if policy makers were serious about modifying Australia’s age structure the most cost effective way to do this would be to support the two-child family. One way to do this would be to prune the immigration intake and, by reducing competition, improve housing affordability. This in itself would promote a modest increase in fertility from its current level of 1.74.
Whatever the level of immigration, Tables 9 and A1 show that a fertility rate of 1.95 produces a lower median age than does one of 1.8 or 1.65, the other two assumptions used in the ABS projections.
Conclusion
Demographic ageing is the outcome of social progress, indeed of revolutionary social change. It proves that we have escaped from the Malthusian trap. And thanks to the longevity dividend, it can provide us with the resources to manage this change.
It is not a threat. The only danger lies in futile attempts to resist it with rapid population growth.
Leith van Onselen is Chief Economist at the MB Fund and MB Super. He is also a co-founder of MacroBusiness.
Leith has previously worked at the Australian Treasury, Victorian Treasury and Goldman Sachs.