
About a month ago, I posted here about how to look at coronavirus statistics. At the time, it was all about early warning signs, ignoring China data and focussing on the rest of the world. That analysis worked well for highlighting the problem early and changing investment strategy in front of the herd.
But that analysis is no longer relevant. It is time to work out what the next phase will be.
The disease is loose globally; there is very little chance of stopping it now. Iran and Italy are “exporting” cases at an exponential rate – far worse than China at a similar stage:

A quick data note. Almost all coronavirus statistics show where the disease is diagnosed. I focus on where it is caught.
Key COVID-19 Questions
- Which data can be trusted? We are looking at South Korea, the Diamond Princess and Singapore as being the best indicators as they are the largest affected countries that have shown to be the most transparent. China, Iran and Italy all have significant question marks over data.
- Is winter an issue? The longer it goes without a meaningful coronavirus outbreak in a tropical country, the more we need to suspect a heat/light/humidity factor. This will have a substantial effect on how adverse the economic impact is.
- How fast is it spreading? The case numbers are still catching up from earlier undiagnosed cases which might make the spread seem faster than it really is. Clearly, there are outbreaks in South Korea, Italy and Iran. Japan is questionable. Outbreaks appear likely in the US, Germany, France and Spain.
- How deadly is it? If contained, our best estimate is in the 0.4% to 1.0% range if the outbreak. It is probably closer to 5% if not contained as in Wuhan and (likely) Iran. It is significantly more deadly for older people.
- How long will it last? At a local level, prior epidemics suggest six weeks in an unconstrained environment (Iran?). In areas with quarantines and shutdowns much longer. At least 3-4 months, more likely double or triple that.
Question 1: Can you trust the COVID-19 data?
Not from all countries.
The chart below illustrates just one of the many reasons why we are sceptical of Chinese data. South Korea now has more than 4x the cases per person than any province in China outside of Hubei:

A month ago, we focussed on the difference between data from Hubei, the rest of China and the rest of the world. Our thesis was the Chinese data appeared to be manipulated, and so we would get much better information from the rest of the world. As more countries report data, the rest of world data is now also showing data quality issues. Iran, Italy and China have data issues.
John Hopkins has a score for each country’s ability to deal with a virus outbreak. The chart below maps the part of the score that deals with a country’s ability to identify and report on diseases vs the number of cases. It should provide a rough guide as to how much trust to put in data from individual countries. Our experience has been that Singapore should be rated higher and Italy and the US lower:

To date, we have found the South Korea data to be of high quality and very transparent. Given the high case count plus the vast number of tests performed, South Korea is the best source of data we have to answer questions.
The Diamond Princess is another good source given we have a constrained sample size and patients in multiple countries. The main issue is the people are generally older and so are probably not representative of the broader society.
Singapore data and quality has also been excellent. Singapore is also testing heavily and is a major transport hub. We are using Singapore and Thailand as our reference data source for tropical countries.
Question 2: Is winter an issue?
If Coronavirus rips through two-thirds of the world population (as reputable coronavirus experts have suggested is possible), then there will be a significant economic effect. If it is limited to countries in winter, then the outcome will be substantially less. We are yet to see a sustained outbreak in a tropical country.
At the moment our base case is coronavirus outbreaks will be mainly in colder countries. We don’t have a lot of conviction in this view as there may be cases that are not yet reported in a range of tropical countries. But the longer it goes without domestic outbreaks in tropical countries, the more our conviction will grow.
We split cases into:
- Winter countries: Northern Hemisphere Countries currently in winter (including Vietnam as the domestic transmission cases are in the north)
- Summer/Equatorial countries: Southern Hemisphere countries now in summer or Countries near the equator where temperatures are relatively high all year
You can see a stark difference between the cases:

There are suggestions that UV-B radiation and vitamin D played a role in reducing deaths in the Spanish Flu pandemic. Other studies suggest humidity greatly reduces the aerosol transmission of viruses, but some suggest humidity increases the surface transmission. It is unknown how these affect COVID-19 – many experts warn against being too optimistic.
Question 3: How fast is COVID-19 spreading?
The best indicator for this is the number of days that it takes for COVID-19 cases or deaths to double. The virus looks out of control in South Korea, Italy and Iran. Japan could go either way.

France, Germany, Spain and the US all look like the countries to watch:

The other significant factor spreading COVID-19 is cases “exported” by Italy and Iran (chart at the top of this post). Both countries are throwing off a huge number of cases which are being diagnosed in other countries. This is highly suggestive of much larger infections in both countries. It also increases the risk that other countries will see outbreaks.
The statistics coming out of South Korea (which is doing the most testing) are suggesting it is significantly more infectious than the World Health Organisation initially thought. The key is stopping the spread in the early stages – which most countries have not done.

The average incubation period of COVID-19 probably less than a week (but could be as much as 24 days). Add 3-4 days before diagnosis. So, you would expect measures like quarantines and travel restrictions to take around ten days before showing up in statistics.
It is important to note that exponential growth means that by the time measures take place, the cases will have doubled twice. Which means if you wait too long, there may be nothing you can do.
Question 4: How deadly is COVID-19?
There are a lot of different takes on the Coronavirus mortality rate. Our best estimate is that it is in the 0.4% to 1.0% range if the outbreak is contained and hospitals are not over-run. It is probably closer to 5% if not contained. It is significantly more deadly for older people.
So, the key to controlling the disease is to ensure that hospitals are not over-run. China was very aggressive in pursuing this. Europe and the US appear not to be.
Next, dividing the number of deaths by the number of cases during the early stages of an outbreak is very misleading. People who were diagnosed today with the disease are still alive, but they still might die from the virus in the coming days.
A better way is to compare the current deaths to the number of cases from “x” days ago. We still don’t know how many days we should be looking back. The stats so far suggest that the median days from the first symptom to death is 14. But with a broad range from 6 to 41. And, we don’t know how long on average after the first symptom a person would take to become a case.
The below charts show the death rate if the right period to look back is 4, 8 or 12 days.
I am most focussed on South Korea and the cruise ship. South Korea is finding more cases because they are looking harder than anyone else and so have a more complete data set.
The cruise ship is interesting as it has a fixed population. But people on the ship were generally older, and older people are more likely to die, I believe the death rates will be over-stated.

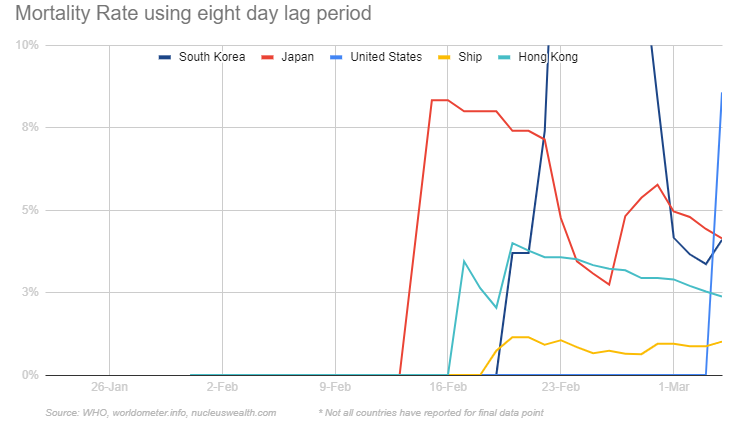
I am no longer convinced the China data means much. However, it is possible that whatever “adjustments” are being made to case numbers are also being made to deaths which might mean the mortality rates for China are OK.


Question 5: How long will it last?
This is educated guesswork. The key factor is if epidemics get out of control, then they can be over relatively quickly in a single location: six weeks to two months (with a lot of deaths). However, if quarantines and shutdowns manage to slow the disease, the epidemic can last for considerably longer. Three months would probably be the best that could be expected. More likely to be multiples of that.
Because there are multiple locations across multiple countries, it is likely to last considerably longer, and there may be multiple waves.
We note the economic trade-off:
- Humanitarian. The bigger the shutdowns, the greater the preventative measures, the fewer people will die.
- Economic. The bigger the shutdowns, the greater the preventative measures, the more significant the economic impact will be.
We would expect markets to start pricing in recovery when developed market cases peak, but note that the economic effects will last longer.
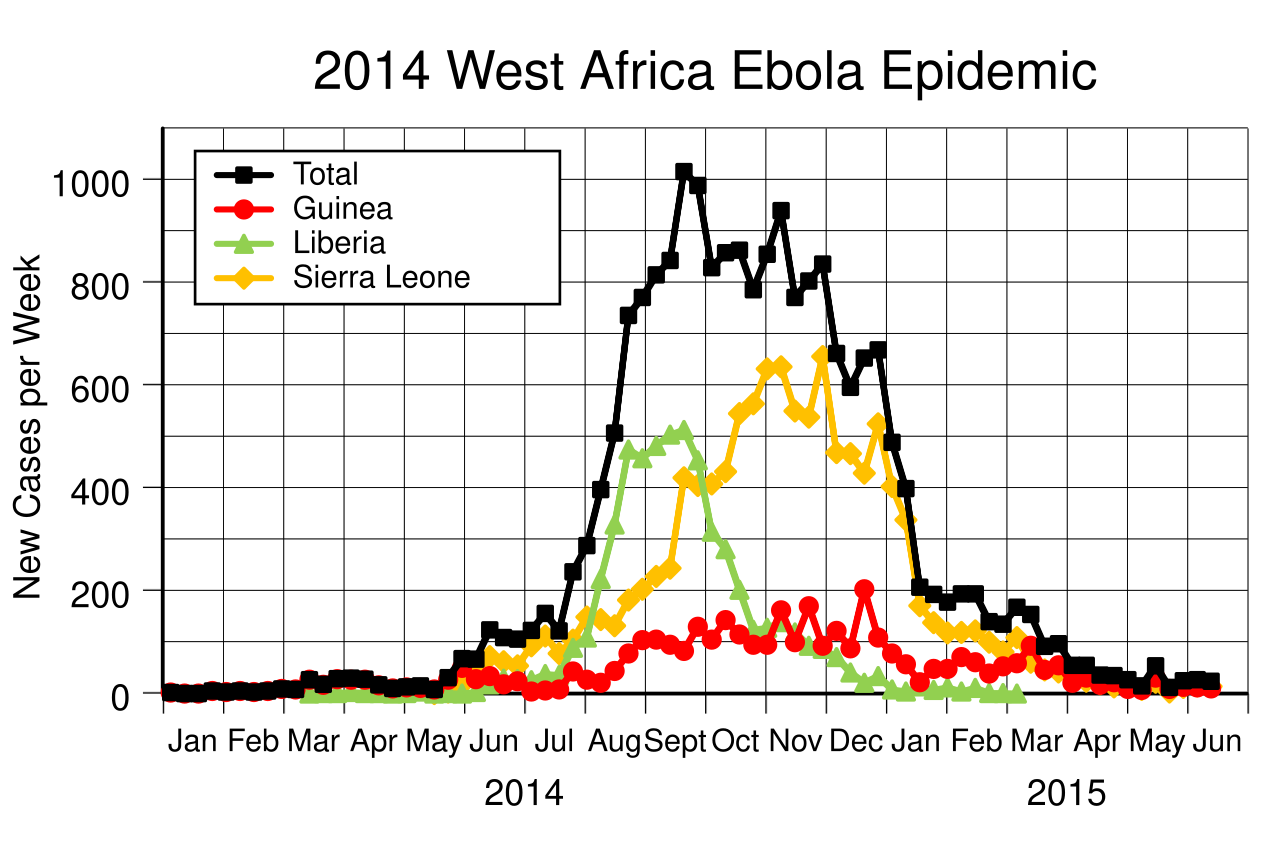
Here are some sample epidemics showing the effect at a city, country and global level:
1918 Spanish Flu Epidemic: Comparing death rates in individual cities
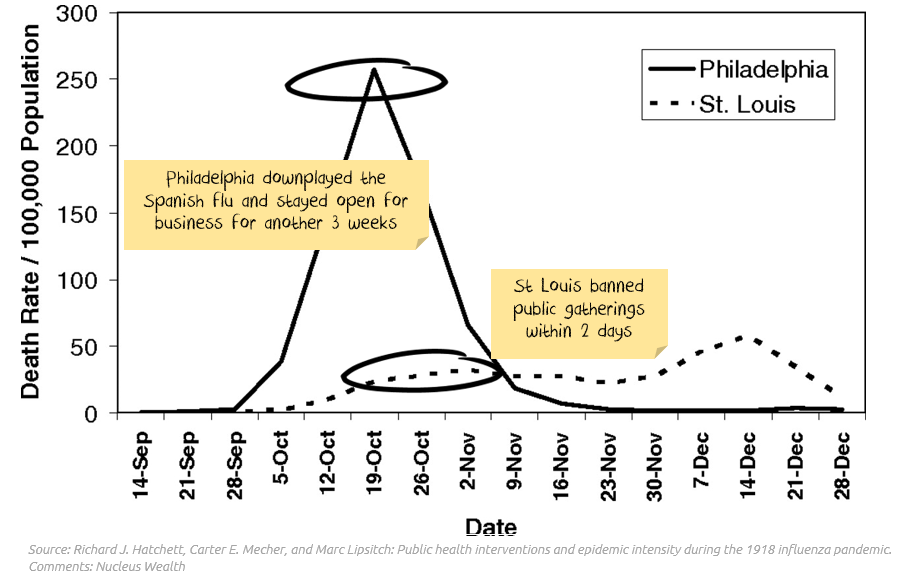
Source: Wikipedia

Source: WHO
Other Coronavirus posts:
- Podcasts: 27 Feb 06 Feb and 23 Jan
- ABC interview 25 Feb
- Blog posts: Feb 28: Letter to Clients, Feb 25: World just Changed narrative is bulls#1t, and 24 Feb: Debt Crisis vs Pandemic, 08 Feb: Extracting Signal from Coronavirus noise, 02 Mar: Is Thailand hiding cases and 03 Feb: Coronavirus is not SARS and it is not 2003
Data sources
This is a list of some of the main data sources we use:
https://nucleuswealth.com/articles/updated-coronavirus-statistics-cases-deaths-mortality-rate/ This has daily updates to the above charts. The charts here are more analytical
https://www.worldometers.info/coronavirus/ Probably the best source of the latest COVID-19 statistics
https://www.capitaleconomics.com/the-economic-effects-of-the-coronavirus/ Good source of fast-moving China economic stats.
https://bnonews.com/index.php/2020/02/the-latest-coronavirus-cases/ If you want to be bombarded with every breaking news story, this is the place
https://ncov.dxy.cn/ncovh5/view/pneumonia Faster than worldometers for Chinese data, but slower on rest of the world data. I don’t think China cases matter anymore.
https://www.who.int/emergencies/diseases/novel-coronavirus-2019/situation-reports I’m less enamoured of the WHO data now than I was at the start of the crisis. They are providing less information now than they were two weeks ago, and it sometimes contradicts country-level data.
https://gisanddata.maps.arcgis.com/apps/opsdashboard/index.html#/bda7594740fd40299423467b48e9ecf6 The prettiest pictures, but one of the slower sites to update. I don’t find the charts that useful.
————————————————-
Damien Klassen is Head of Investments at the Macrobusiness Fund, which is powered by Nucleus Wealth.
The information on this blog contains general information and does not take into account your personal objectives, financial situation or needs. Past performance is not an indication of future performance. Damien Klassen is an authorised representative of Nucleus Wealth Management, a Corporate Authorised Representative of Nucleus Advice Pty Ltd – AFSL 515796.