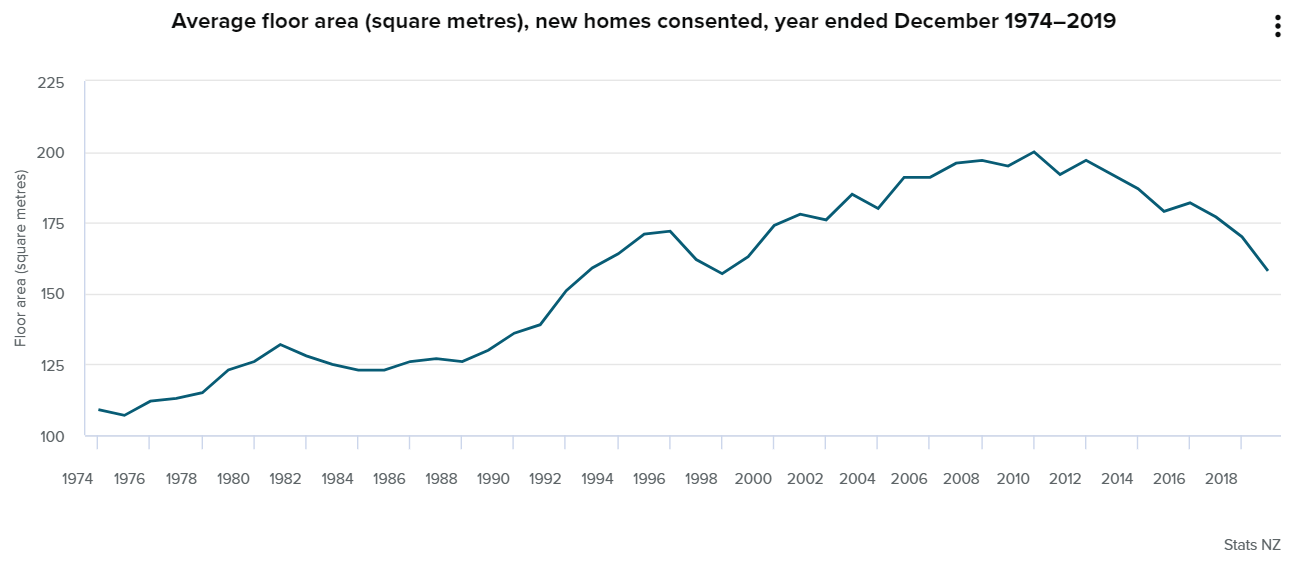
Statistics New Zealand has released data showing that the average floor area of new homes consented in 2019 was about 21% (42 square metres) smaller than the peak of 200 square metres in the December 2010 year, and has fallen to mid-1990s levels:
“The drop in new home size is primarily due to stand-alone houses getting smaller,” construction statistics manager Melissa McKenzie said.
“While stand-alone houses still account for the majority of new homes in New Zealand, an increasing proportion of townhouses, apartments, retirement village units, and other multi-unit homes consented in recent years has also contributed to smaller overall home sizes.”
The median floor area of new stand-alone houses consented in 2019 was around 180 square metres, down from just over 200 square metres in 2010. The median floor area of multi-unit homes has hovered around 100 square metres (which includes a portion of any shared spaces).
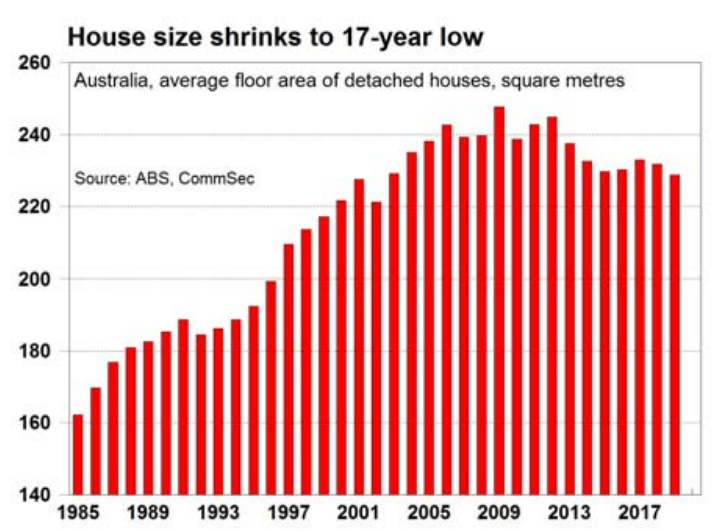
It’s a similar story in Australia, as revealed in November by CommSec:
The average size of an Australian free-standing house has fallen to 17-year lows. Data commissioned by CommSec from the Australian Bureau of Statistics, shows the average new house built in 2018/19 was 228.8 square metres, down 1.3 per cent on a year ago to the smallest house size since 2001/02.
While the size of an average house shrunk over the past year, the size of the average Australian apartment actually grew by 3.2 per cent over the past year to 128.8 square metres.
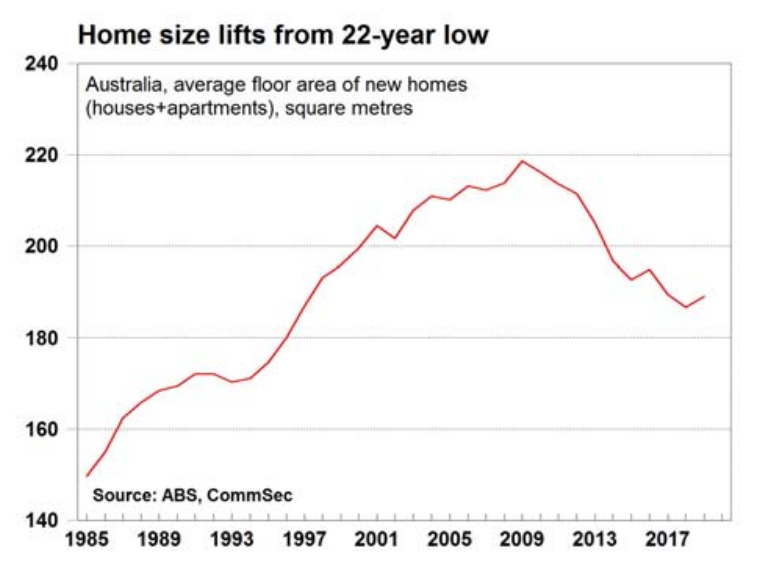
Overall, the average new home (houses and apartments) built in 2018/19 was 189 square metres, up by 1.2 square metres over the year from 22-year lows.
Advertisement
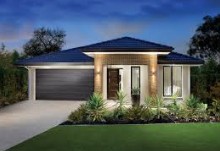
It’s important to note that home sizes in both Australia and New Zealand have been artificially inflated by the trend towards enclosed garages, which have replaced car ports across many newly built homes (example below).
Indeed, the ABS measures floor area as:
Advertisement
…the amount of useable space in a building (and its attachments) at the final stage of its construction and is measured in square metres (m²). The boundary of the recorded floor area of a building is delineated by the external perimeter of the exterior walls of the building. The area under unenclosed verandahs, carports, etc., attached outside the exterior walls of one or more storeys, is excluded.
Statistics New Zealand also noted the following:
The average size of homes consented in the year ended December 1974 was about 110 square metres, compared with around 160 square metres in 2019. Floor areas consented in recent years are more likely to include attached garages, than those consented in the 1970s. An attached double garage could add around 36 square metres to a new home.
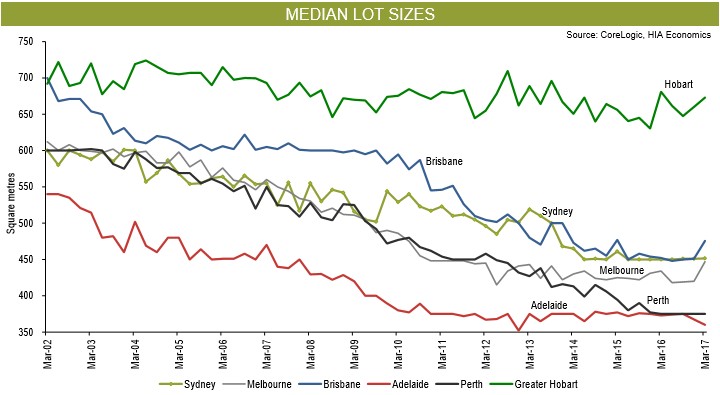
Second, it is not just floor area that is shrinking, but lot sizes as well. According to CoreLogic, average Australian capital city lots shrunk from around 700 square metres in 1996 to just 450 square metres as at 2017 – a decrease in size of 35% over 20 years:
Advertisement
While I don’t have specific data for New Zealand, we can assume the same land cost inflation has occurred there as well.
The truth of the matter is that both Australians and Kiwis have been spending much more on housing and receiving a lot less in return.
Leith van Onselen is Chief Economist at the MB Fund and MB Super. He is also a co-founder of MacroBusiness.
Leith has previously worked at the Australian Treasury, Victorian Treasury and Goldman Sachs.