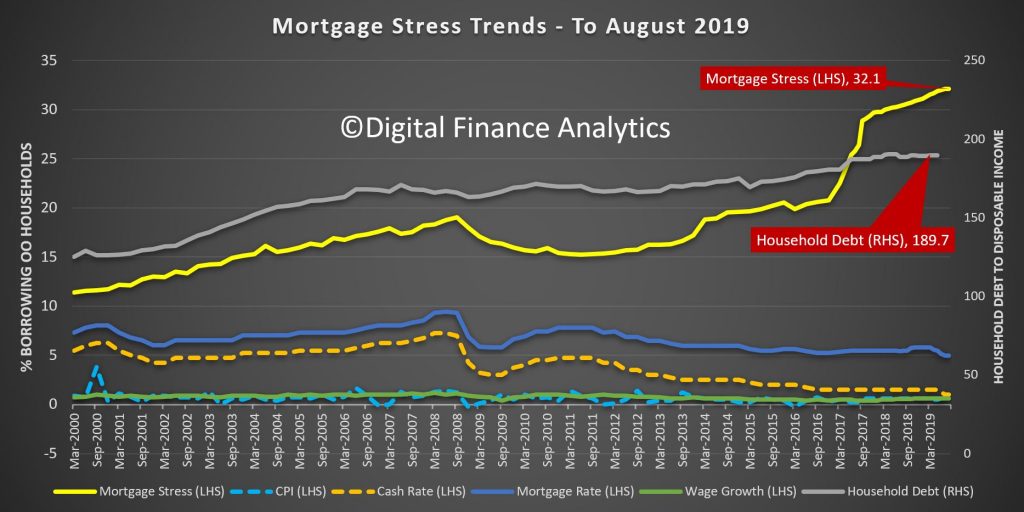
For the first time since 2015 the overall level of mortgage stress did not rise significantly in August, according to the latest research from Digital Finance Analytics, based on our rolling 52,000 household survey.
That said, the proportion of households whose cash flow is under pressure when servicing their mortgages remains elevated at 32.1% of borrowing households. This is still a record high. And average household debt to income ratios continue to rise – reaching 189.7 according to recent RBA data. This ratio, reported quarterly, includes all households, not just borrowing ones, and SME’s as well. For the one third of households borrowing the average ratio is at 550 according to our data. Banks are still willing to write loans above six times income in some circumstances.
The combination of lower mortgage rates and the tax refunds, plus some more significant wage increases in some sectors helped to stabalise the results.
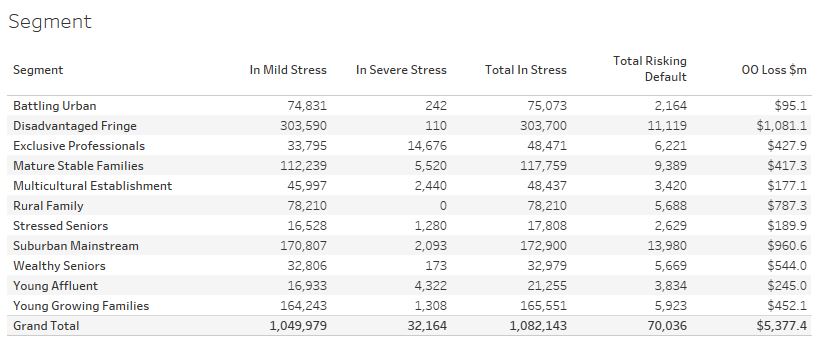
The total number of households in stress is now 1,082,000, compared with 1,080,000 last month. We continue to see households across our segments coping with the financial pressures resulting from large mortgages, flat incomes and rising costs. There are a growing number of older households in difficulty.
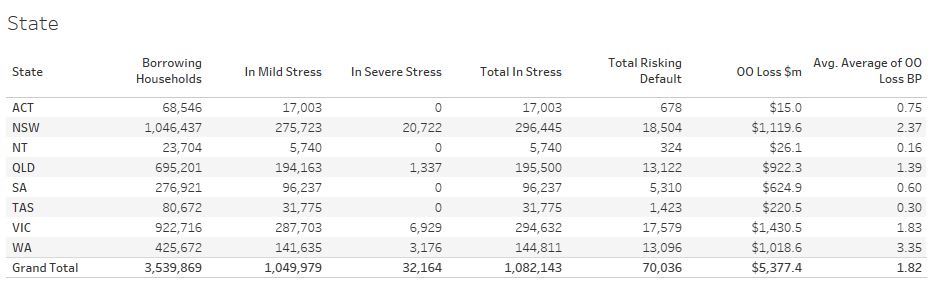
Across the states, pressure is rising in NSW and VIC, as the broader economic trends deteriorate. The trajectory of unemployment and underemployment will be critical ahead. Relatively speaking losses remain higher in WA, where the economy has been in the doldrums for several years, but it is plausible we will see economic weakness spreading. The construction sector is under pressure, and job losses are to be expected ahead.
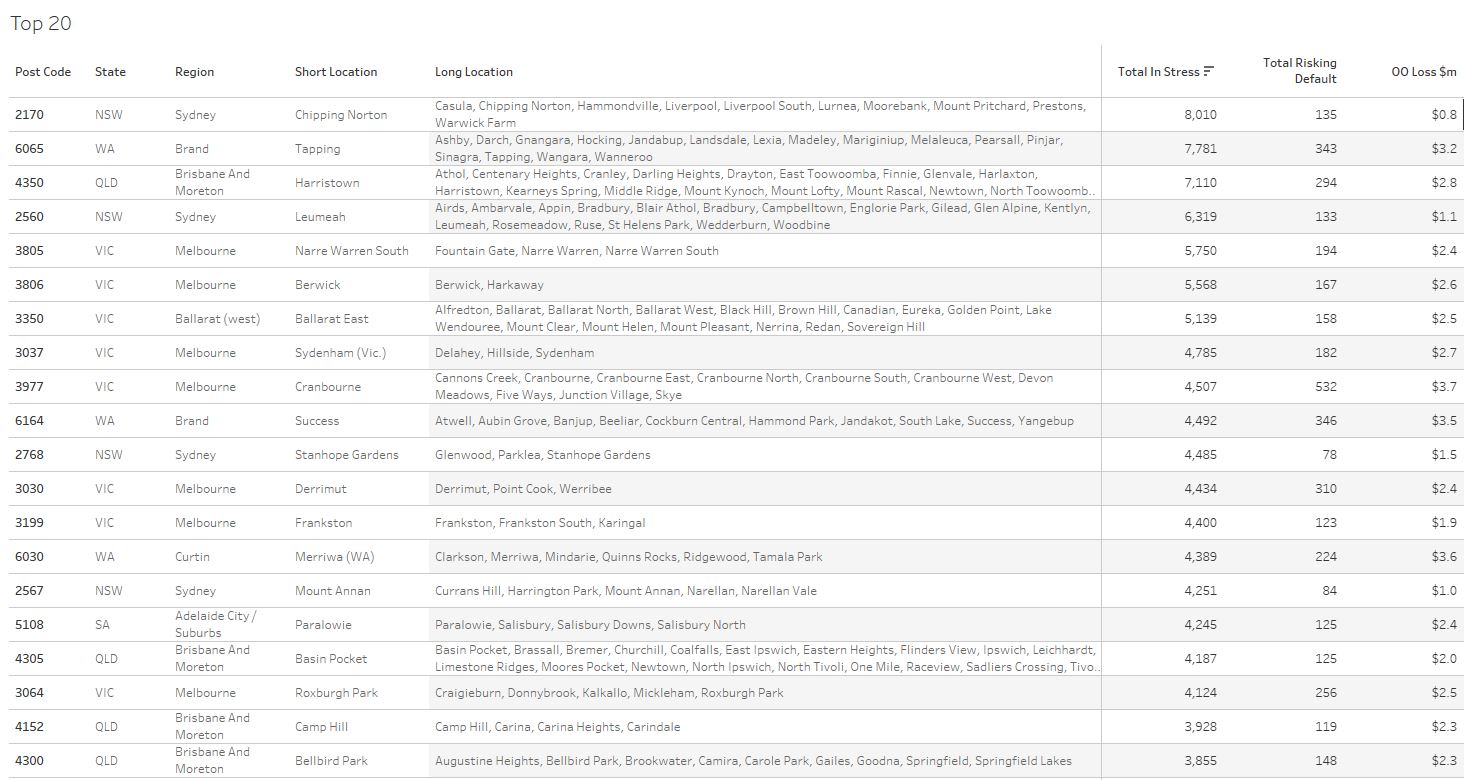
Mortgage stress is not just concentrated in the main urban centres, we continue to see signs in regional centres as well.
The current top 20 post codes by mortgage stress shows that Liverpool 2170 has the highest count, followed by post code 6065 in WA.
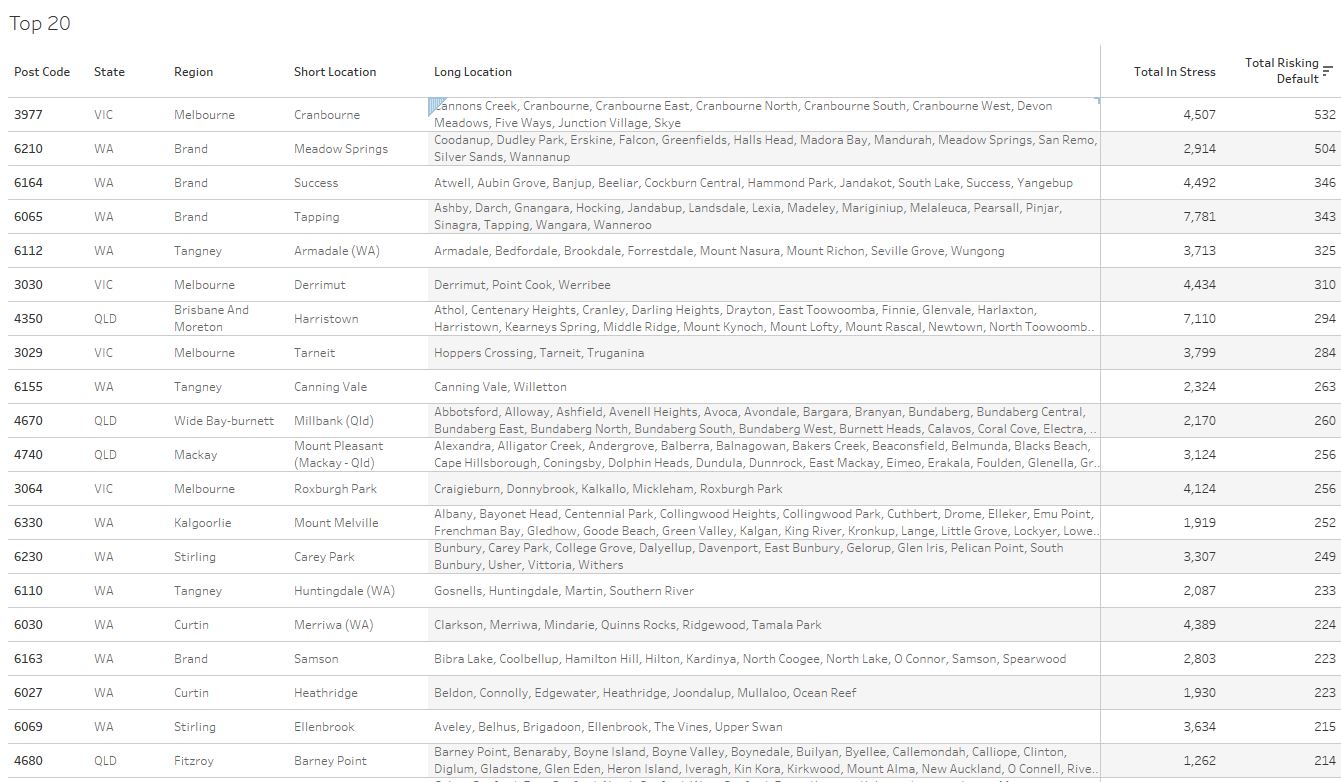
Another way to look at the top 20 is by defaults. Here Cranbourne in VIC, 3977 comes at the top of the list followed by 6210 in WA, which includes Mandurah.
Many on the list are in the urban fringe where there has been high rates of construction, often on small plots. The peak of distress is from the 2015 and 2016 cohorts, before the lending standards were tightened, but it is also the case that the journey many households take from stress, severe stress to default is one which can play out over years, not months.
With more rate cuts it should begin to ease, until the global shock lands.
David Llewellyn-Smith is Chief Strategist at the MB Fund and MB Super. David is the founding publisher and editor of MacroBusiness and was the founding publisher and global economy editor of The Diplomat, the Asia Pacific’s leading geo-politics and economics portal.
He is also a former gold trader and economic commentator at The Sydney Morning Herald, The Age, the ABC and Business Spectator. He is the co-author of The Great Crash of 2008 with Ross Garnaut and was the editor of the second Garnaut Climate Change Review.