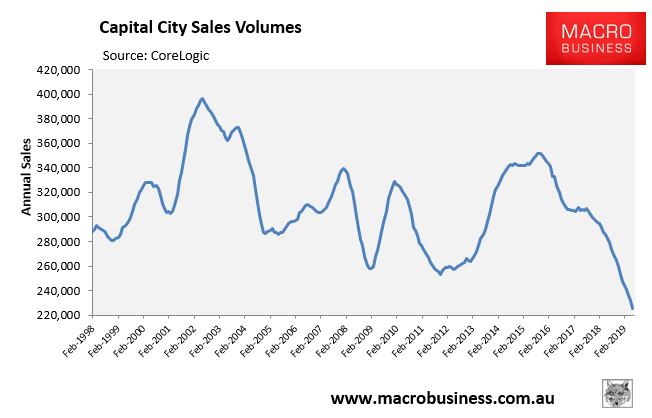
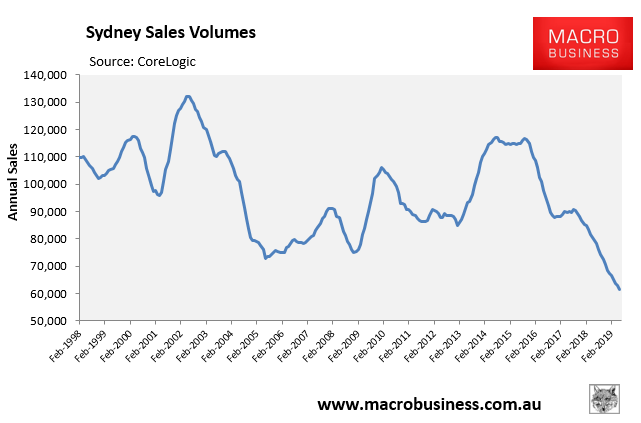
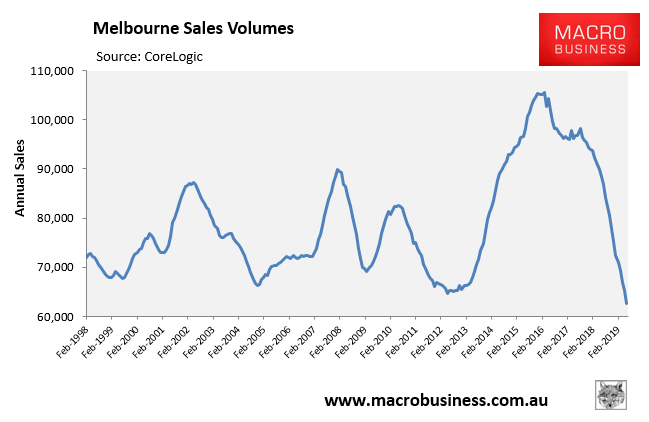
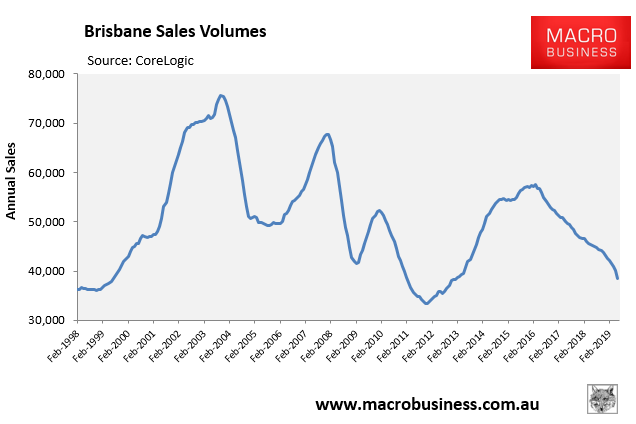
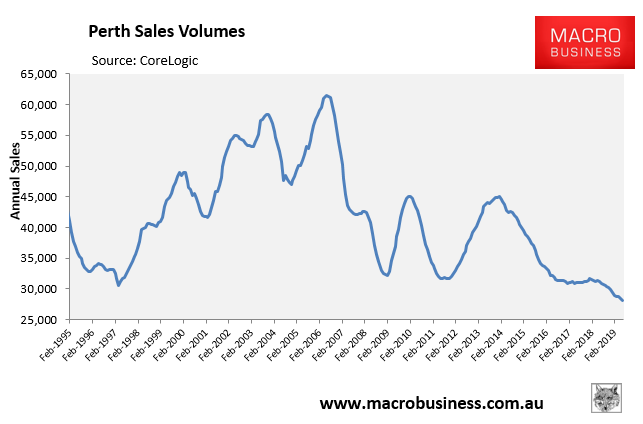
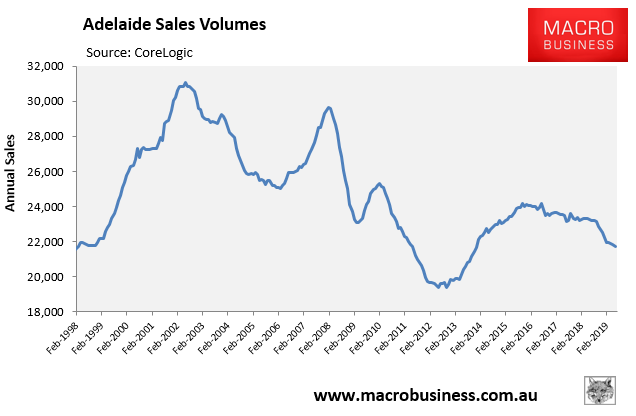
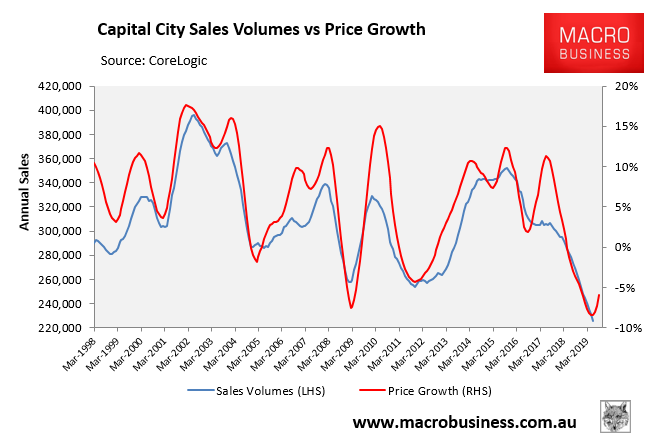
Below are the latest charts, derived from CoreLogic data, plotting annual sales volumes across Australia’s capital cities to May 2019:
Advertisement
Advertisement
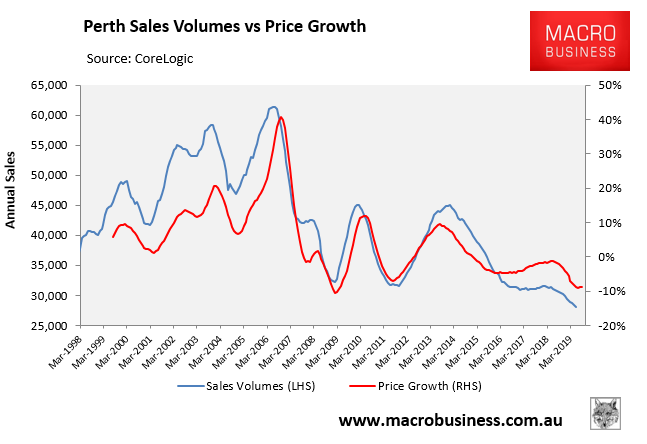
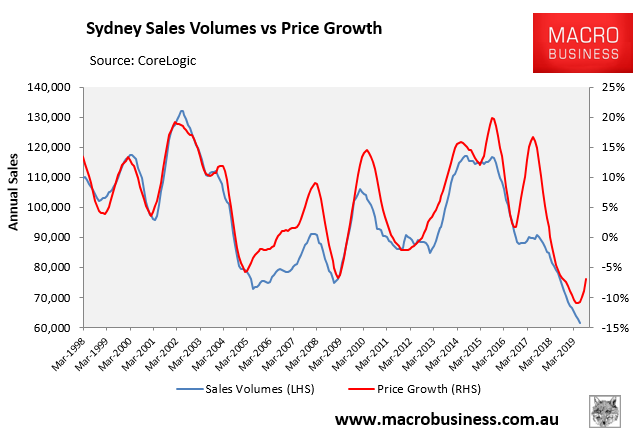
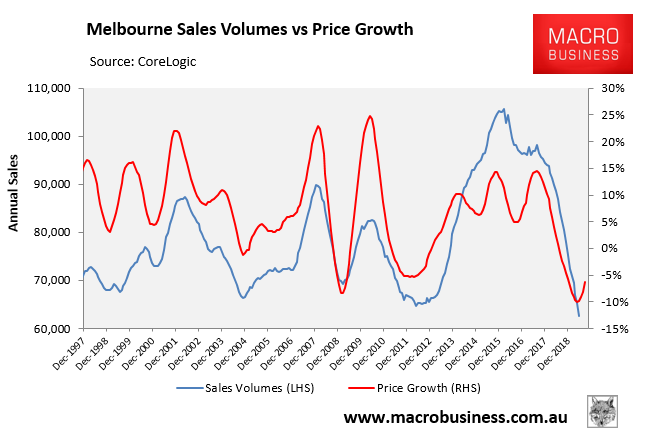
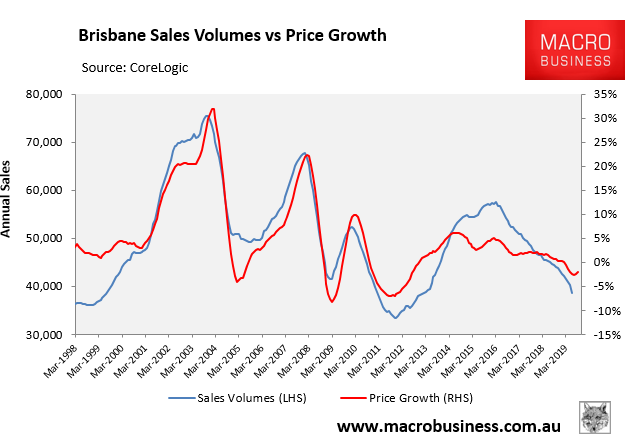
Sydney (-48%), Melbourne (-38%), Brisbane (-41%), and Perth (-37%) are all down massively from their most recent peaks, whereas across the combined capitals sales are down 36%. In fact, the last time annual sales volumes were this low was in January 1996.
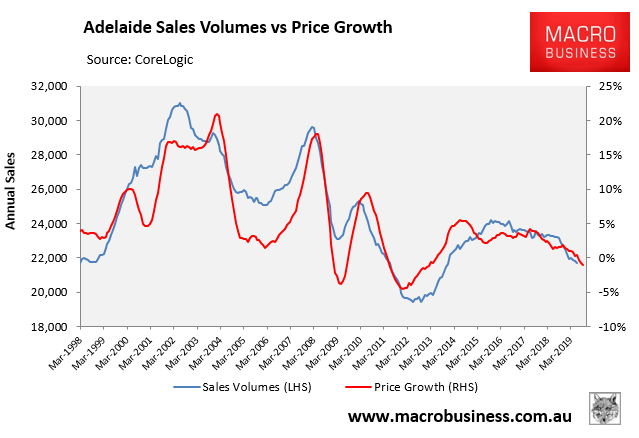
The following charts plot the annual changes in sales volumes and dwelling values, as measured by CoreLogic, which shows a very strong correlation historically, but wide divergence now:
Advertisement
Advertisement