Advertisement
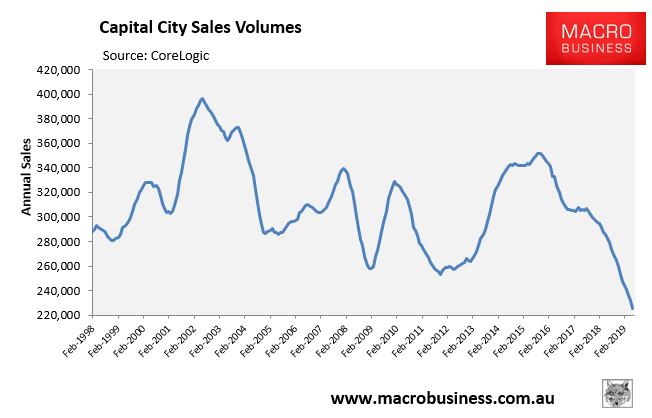
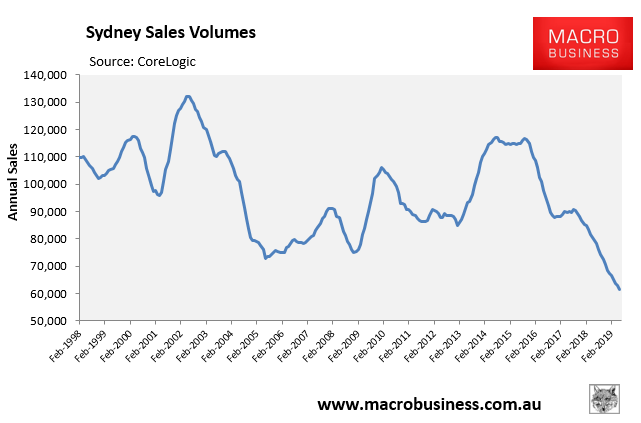
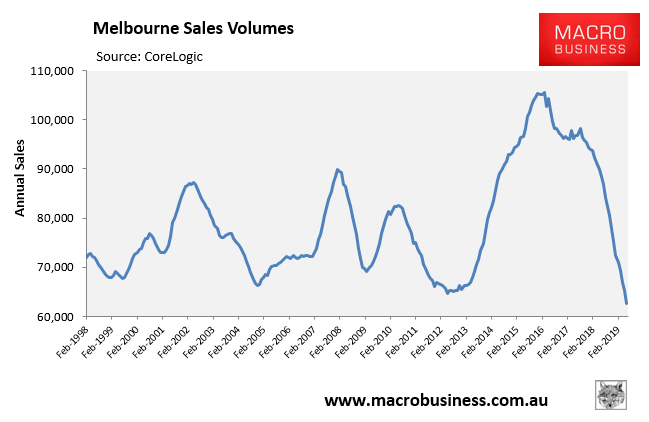
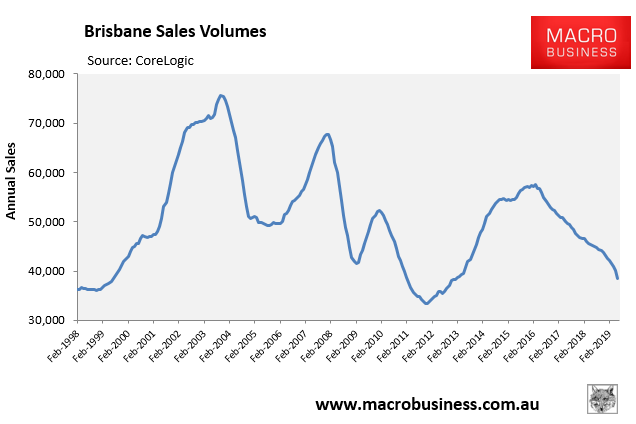
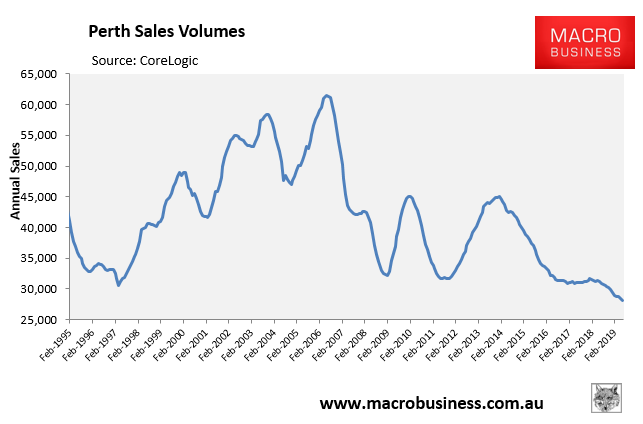
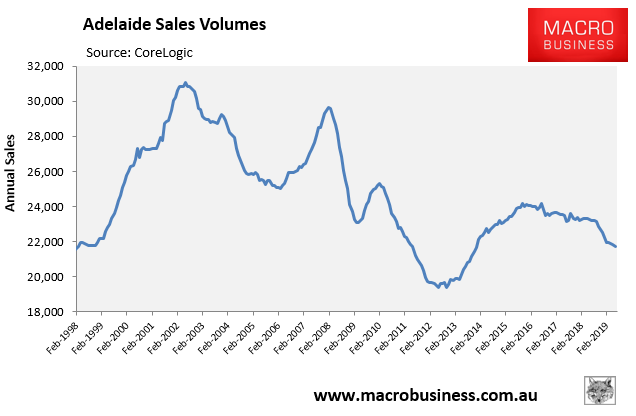
Below are the latest charts, derived from CoreLogic data, plotting annual sales volumes across Australia’s capital cities to May 2019:
Advertisement
Advertisement
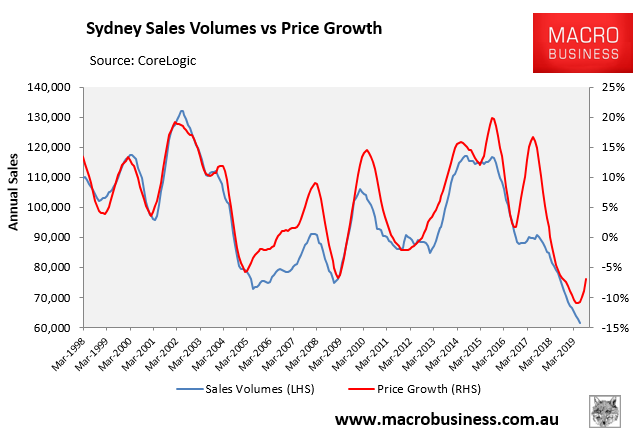
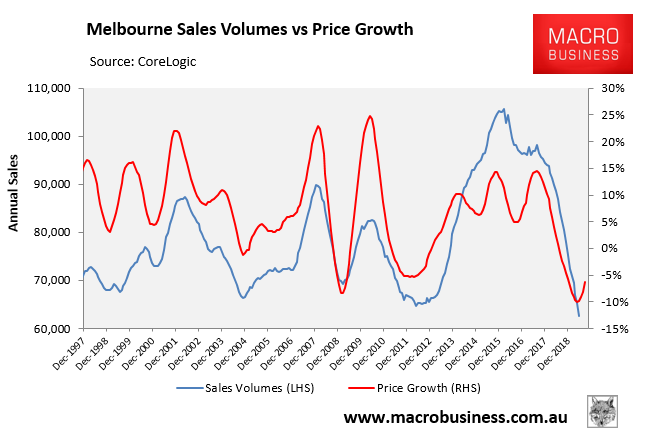
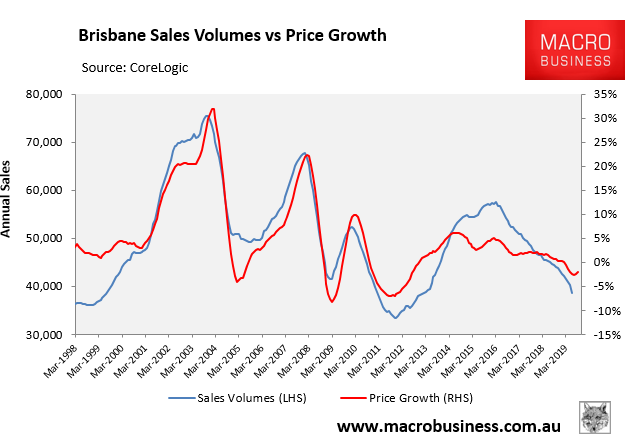
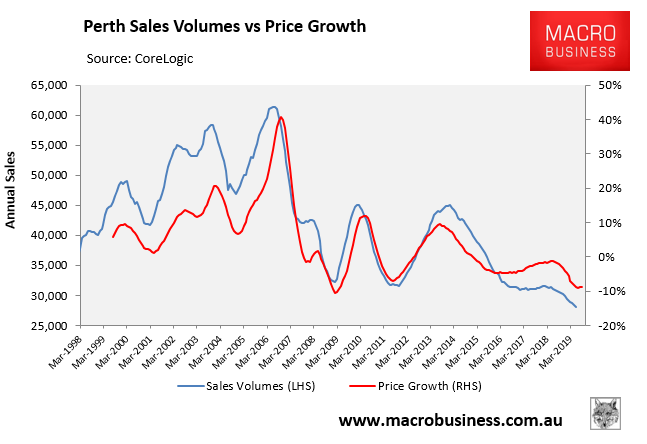
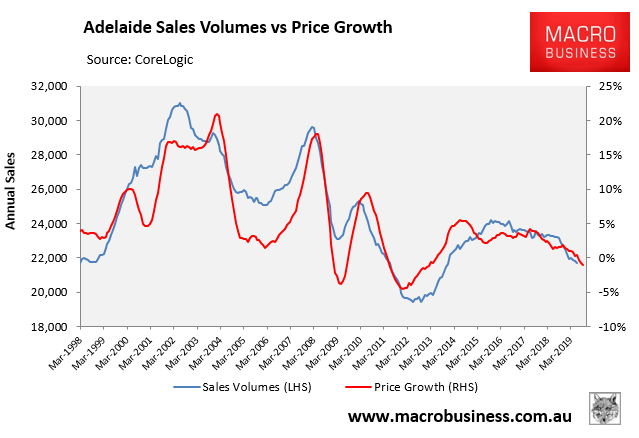
Sydney (-48%), Melbourne (-38%), Brisbane (-41%), and Perth (-37%) are all down massively from their most recent peaks, whereas across the combined capitals sales are down 36%. In fact, the last time annual sales volumes were this low was in January 1996.
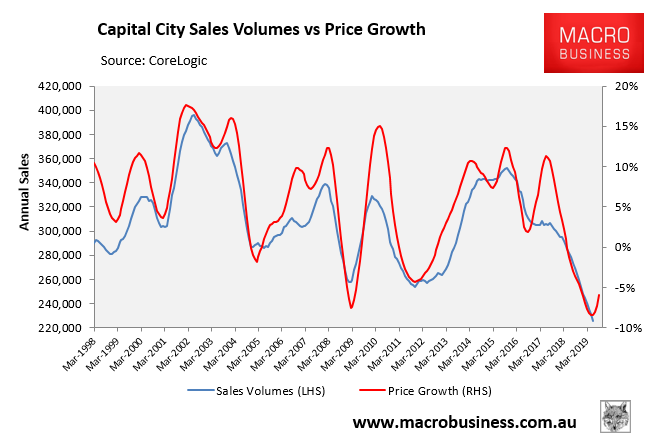
The following charts plot the annual changes in sales volumes and dwelling values, as measured by CoreLogic, which shows a very strong correlation historically, but wide divergence now:
Advertisement
Advertisement
The full text of this article is available to MacroBusiness subscribers
Cancel at any time through our billing provider, Stripe
About the author

Leith van Onselen is Chief Economist at the MB Fund and MB Super. He is also a co-founder of MacroBusiness.
Leith has previously worked at the Australian Treasury, Victorian Treasury and Goldman Sachs.