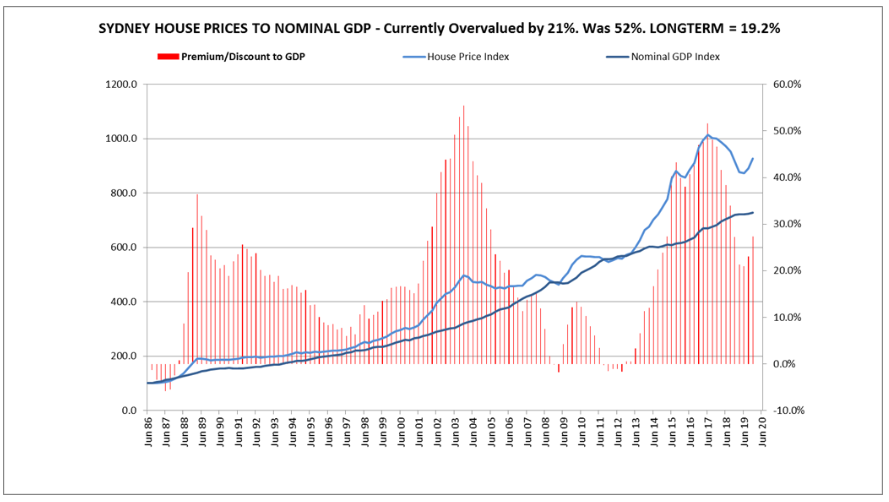
SQM Research’s managing director, Louis Christopher, released his weekly email newsletter last night, which claimed that Sydney’s housing overvaluation has fallen from a peak of 52% to 21%:
The Sydney housing market has bottomed out. Many leading indicators now suggest the current September quarter will record about a 2% rise in Sydney dwelling prices and we are expecting a rise of another 4% for the December Quarter. That should take the full year to about a 1% gain compared to 2018.
But let it be known Sydney has bottomed out at an overvalued point. The data suggests the Sydney housing market remains 21% overvalued despite the two year correction. For reference, the average overvaluation (since 1986) in Sydney is 19% with a low point of 5.9% ‘undervalued’ in June 1987 and a high point of 55.5% overvalued in December 2003. The most recent overvalued point was 51.6% in the June Quarter 2017. The most recent undervalued point was 1.6% undervalued in September 2012.
This is all based on our view that there is a relationship between nominal GDP and house prices. And when you read this chart we think the evidence is there. Logically there should be a relationship. Housing price rises cannot outpace income growth forever. And the more the gap between the two, the more housing prices have to be supported by cheaper and easier access to credit.
Historically, the Sydney housing market has rarely been undervalued. There has nearly always been some sort of premium attached.
Effectively the current point suggests, that, left unchecked, we could soon be heading towards yet another historic overvaluation point similar to levels recorded in 2003 and 2017. The key word though in this is “unchecked”. How will the regulators respond when they read newspaper headlines of a new booming Sydney housing market recording annualised double digit percentage price growth?
Our initial thinking is they are unlikely to respond well and may introduce more lending restrictions once again. Then again, if the powers that be feel cornered due to perhaps rising unemployment pressure or the need to hit inflation targets, etc., they may well let the market run.
And then finally consider what happens if we have another rate cut?
Next week we will run the chart for Melbourne.
Let me state from the outset that I disagree strongly with SQM’s choice of valuation metric, which has simply compared the growth of median house prices (as measured by the ABS) against the total growth of the economy (as measured by nominal GDP). This is the wrong approach as nominal GDP includes the impact of population growth, which has risen strongly over the period. Moreover, it does not account for the fact that Australian households’ share of GDP has been falling:
Advertisement
A more consistent methodology would be to compare either:
Median house prices against nominal GDP per capita;
The total value of dwellings against nominal GDP; or preferably
Median house prices against household income.
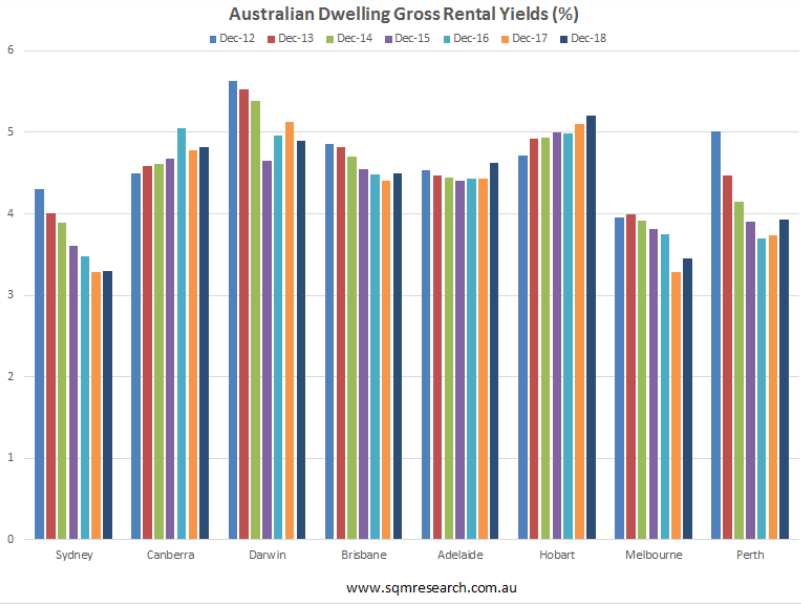
It is also worth pointing out that separate data from SQM shows that despite the heavy price falls, gross rental yields across Sydney remain at ridiculously low levels:
Advertisement
This suggests that Sydney housing remains way overvalued and further heavy price falls are necessary to restore valuations back to sensible levels.
Leith van Onselen is Chief Economist at the MB Fund and MB Super. He is also a co-founder of MacroBusiness.
Leith has previously worked at the Australian Treasury, Victorian Treasury and Goldman Sachs.