
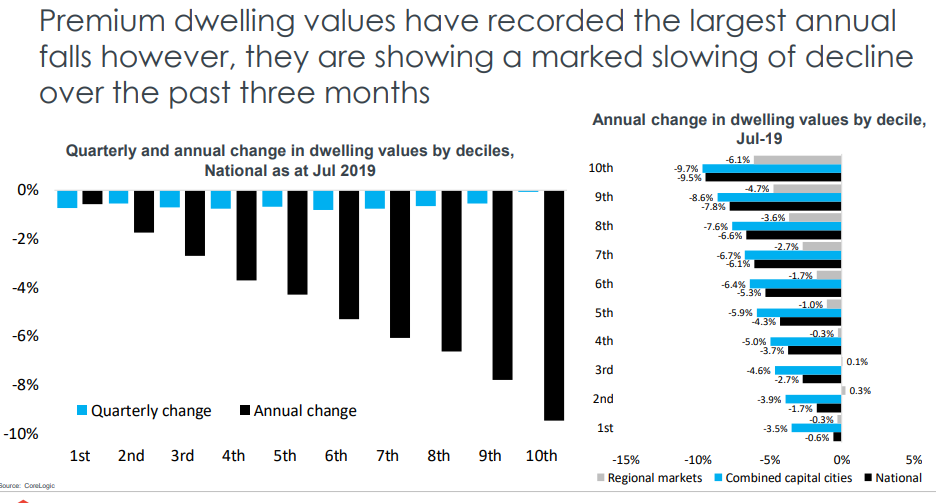
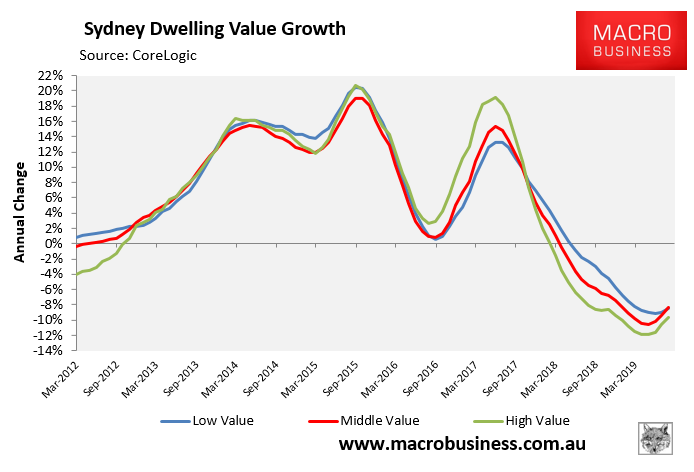
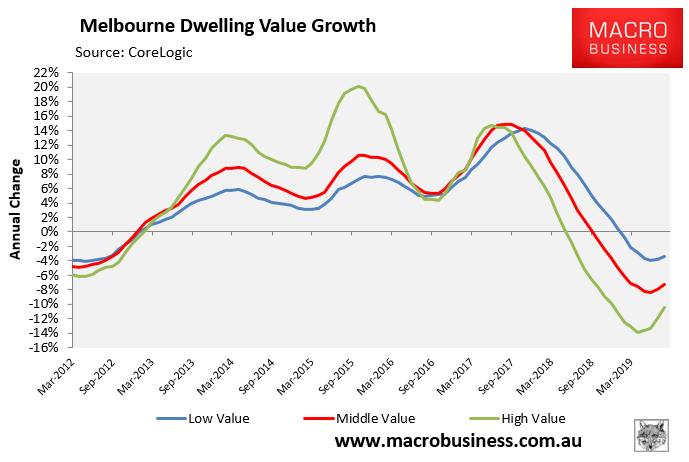
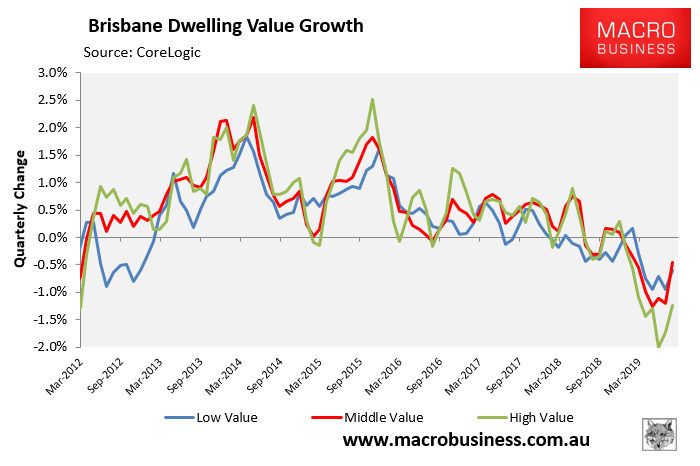
CoreLogic’s August chart pack shows that the premium end of the market suffered the biggest declines in the year to July, but have also led the recovery over recent months:
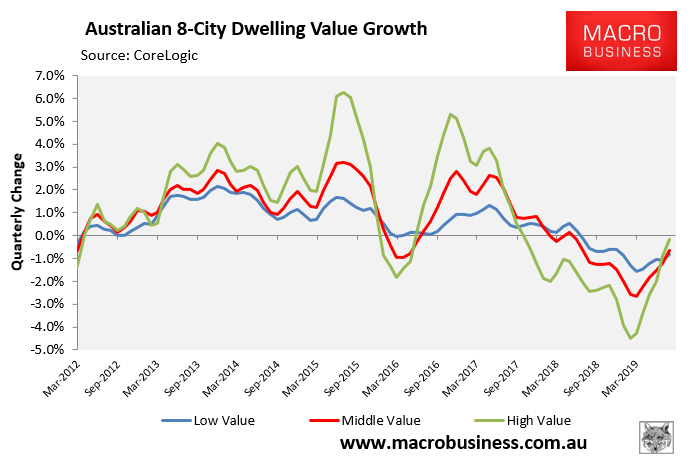
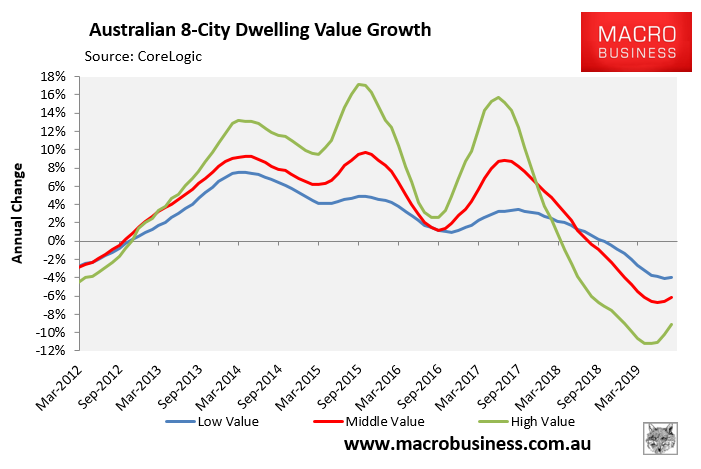
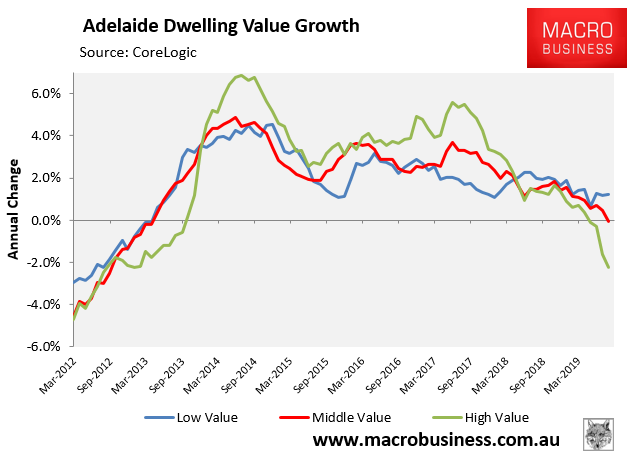
To add more colour, below is CoreLogic data examining price growth across the three broad market segments – bottom 25%, middle 50% and top 25%. This also shows that the most expensive properties have shown the most improvement, and are leading the nascent price recovery.
National:
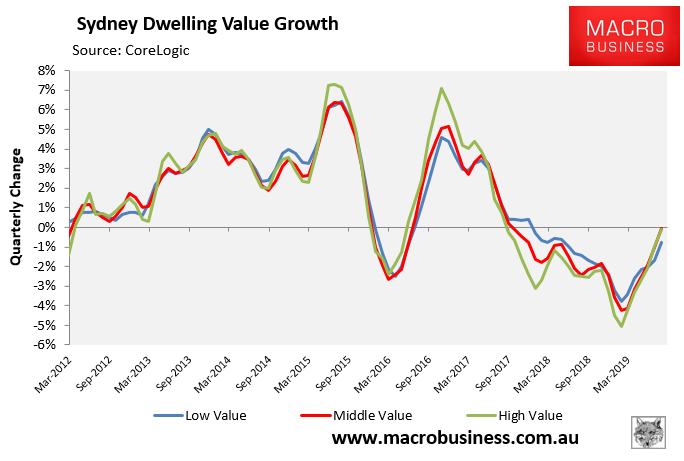
Sydney:
Melbourne:
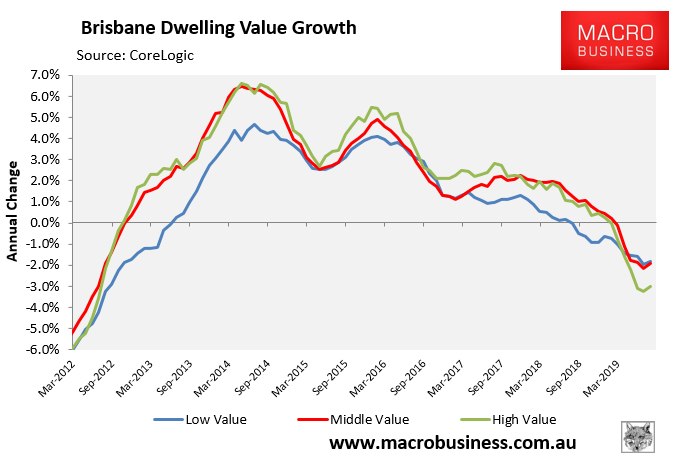
Brisbane:
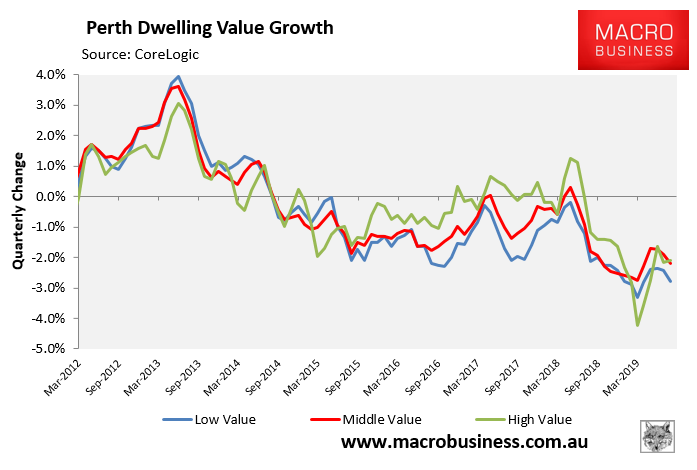
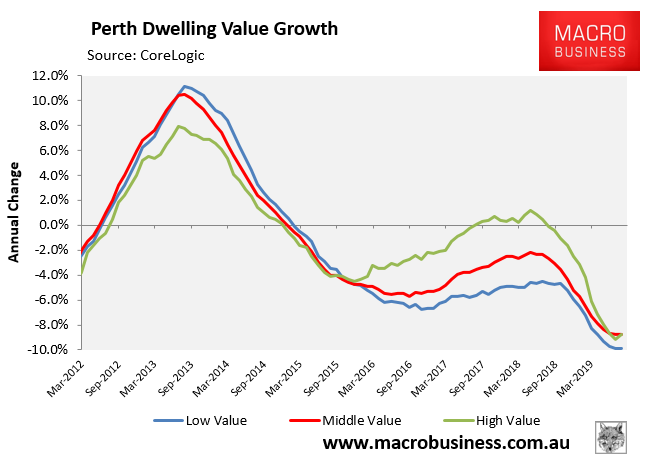
Perth:
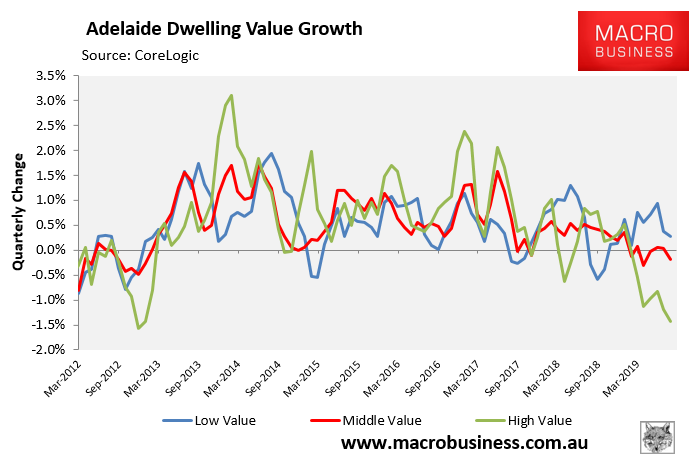
Adelaide:
After experiencing much larger falls than the other two segments (following a larger growth phase), the most expensive segment of the market is seeing the strongest recovery, led by Sydney and Melbourne. This is a trend that has played out before whereby premium housing values fall the fastest initially but also sees the falls cease earlier than other market segments.
