US July retail sales rose +0.7%m/m (est. +0.3%) and +1.0%m/m for the core control group (est. +0.4%), with only minor -0.1% revisions to the prior month’s strong report. August business surveys from the Philly Fed (16.8, est. 9.5, prior 21.8) and NY Empire (4.8, est. 2.0, prior 4.3) soundly beat expectations, with the Philly report maintaining solid expectations, though these did “wane” in the Empire report. New orders remained continued to be strong. 2Q unit labour costs at +2.4%q/q (SAAR), versus est. +2.0%q/q, were also stronger than expected, with sound upside revisions to the prior quarter (5.5% versus prior -1.6%). Productivity rose 2.3%q/q (SAAR) versus est. of +1.4%. July industrial production slipped -0.2%m/m (est. +0.1%m/m), but the prior month was revised to +0.2%m/m from flat. August NAHB homebuilder sentiment survey index rose to 66 versus expectations of unchanged at 65. June business inventories did not rise (flat versus expected +0.1%m/m), whilst sales rose and the inventory to sales ratio pulled back from the recent high (of 1.40) to 1.39.
UK July retail sales rose +0.2%m/m on both headline and core (both expected to slip -0.2%m/m). Revisions to annual data meant that headline sales rose +3.3%y/y (est. +2.5%) and core rose +2.9% (est. +2.3%). There was a notable lift in July on-line sales.
ECB’s Rehn (Finland) said in an interview with DJ/WSJ that they were preparing for substantial stimulus in September. He said it’s better to overshoot than undershoot on stimulus, and need a significant easing package in September. The weakening economy justifies a monetary policy response which should include rate cuts and substantial bond purchases, and beat expectations.
Chinese comments on US trade tariffs stated that the US had violated prior consensus and that China would take countermeasures on US. An hour later, the Chinese Ambassador to UK held a press conference on the “gravest situation in HK since the handover”. He spoke strongly about unwarranted foreign intervention in HK and unbalanced media reporting, calling for both to stop.
Event Outlook
NZ: manufacturing PMI has trended lower over the past two years, but is holding just above the 5o level (expansionary/contractionary).
Euro Area: Jun trade balance is released.
US: Jul housing starts and building permits are expected to show stabilising activity. Aug University of Michigan Consumer Sentiment is anticipated to hold at an upbeat level of 97.0 from 98.4 in Jun.
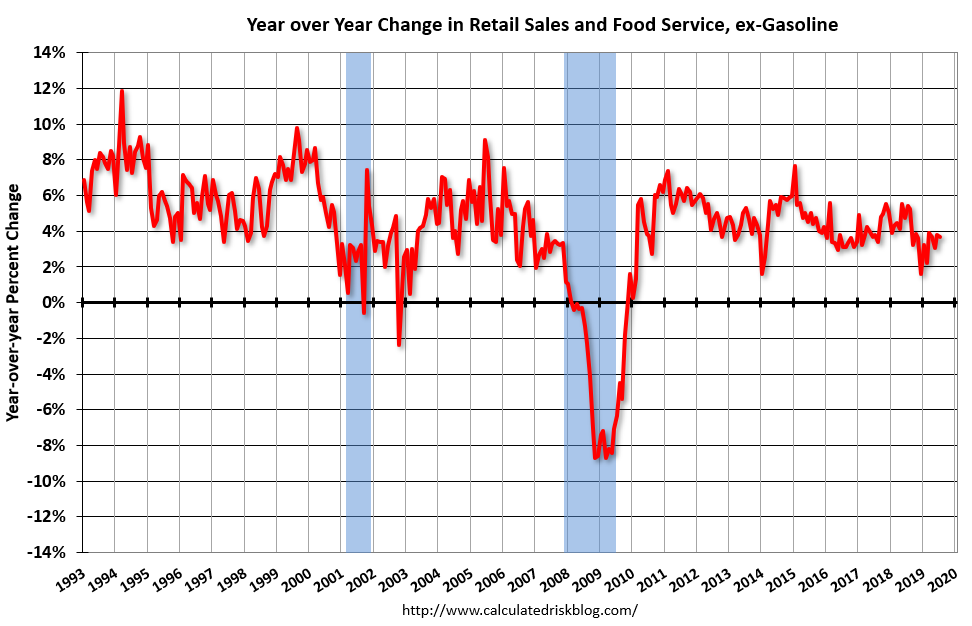
DXY was lifted by US retail sales, which were great:
Advertisement
Advance estimates of U.S. retail and food services sales for July 2019, adjusted for seasonal variation and holiday and trading-day differences, but not for price changes, were $523.5 billion, an increase of 0.7 percent from the previous month, and 3.4 percent above July 2018. … The May 2019 to June 2019 percent change was revised from up 0.4 percent to up 0.3 percent.
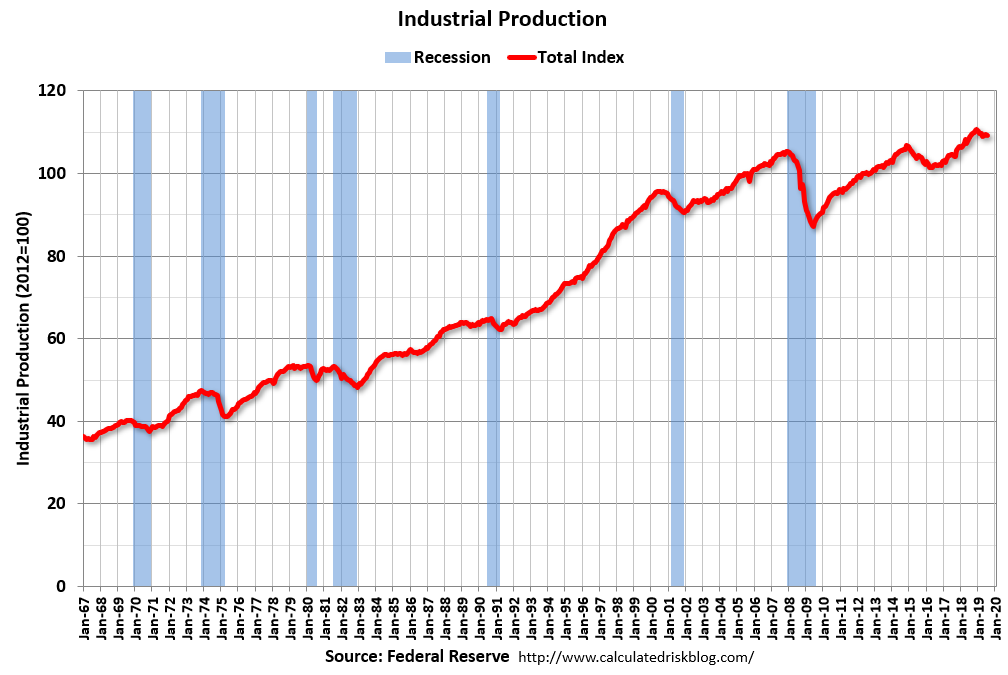
Industrial production declined 0.2 percent in July. Manufacturing output decreased 0.4 percent last month and has fallen more than 1-1/2 percent since December 2018. In July, mining output fell 1.8 percent, as Hurricane Barry caused a sharp but temporary decline in oil extraction in the Gulf of Mexico. The index for utilities rose 3.1 percent. At 109.2 percent of its 2012 average, total industrial production was 0.5 percent higher in July than it was a year earlier. Capacity utilization for the industrial sector decreased 0.3 percentage point in July to 77.5 percent, a rate that is 2.3 percentage points below its long-run (1972–2018) average.
Advertisement
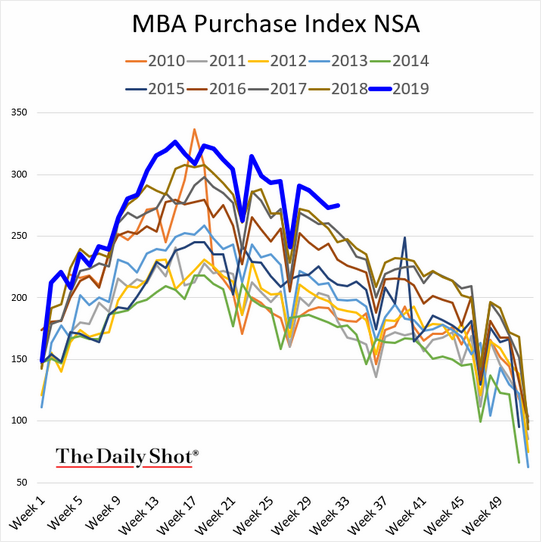
But builder confidence was up and mortgages are booming again as the long bond crumbles:
Hard to see the US falling too far when housing is warming up. Stocks will have to crash and shatter household sentiment.
Advertisement
Will they? Charles Gave explores the question:
I always try to be a rules-driven investor. And when the US stock market is down -3% in a day, taking it to -6% from its peak in three weeks, when 10- year US treasury yields have halved in nine months to just 1.55%, and when gold is up 20% in three months, it is a good time to review those rules to see what they can tell me. The answer is: quite a lot.
One of the core tenets of my approach to portfolio construction is that to hedge the equity portion of my portfolio, I know I can use gold if the economy is in an inflationary period, and long-dated US treasury bonds if it is in a disinflationary interlude.
The trick is to determine whether the economy is in an inflationary period or not. I tend to look at the markets. If gold has outperformed the 10-year US treasury over the previous five years, I can stop asking questions and hedge with gold. Conversely, if the bond market has outperformed, I can go ahead and hedge with long bonds, providing its valuation is not too demanding.
Now please take a look at the chart overleaf. The upper pane shows the price of gold plotted against the total return index of the 10-year treasury. The lower pane shows the ratio of the two series. Looking at the ratio, it is clear that from 1971 to 1984, investors should have used gold as their hedge. From 1985 to 2002 they should have chosen US long bonds; then from 2003 to 2012 gold, and from 2014 to May 2019 US long bonds once again.
Since May 2019, when the treasury total return/gold ratio fell below its fiveyear moving average, I have been recommending that investors switch from overvalued bonds to gold as the preferred hedge for their equity exposure (see The Inflation Shift And Portfolio Construction). Usually, these two assets—long-dated US treasuries and gold—tend to be negatively correlated. When treasuries are going up, gold tends to go down, and vice versa.
But in the last few months, both have powered ahead at the same time. This left me scratching my head, and as usual when puzzled, I reached for the history books to see when in the past both treasuries and gold have looked overbought at the same time. Specifically, I looked for other occasions when the three-month rate of change for each asset was above its respective standard deviation at the same time.
The conclusion is striking: we are in a panic. There were plenty of market panics in the 1970s, when real rates were negative. Then from 1980 to 2007, when short rates were “normal”, they were almost non-existent. However since 2007, there have been several occasions when— unusually—both treasuries and gold went up at the same time.
Here they are:
• The beginning of the global financial crisis.
• The end of the global financial crisis.
• The bond market meltdown in peripheral Europe which prompted Mario Draghi’s “whatever it takes” put.
• The slowdown in China which led to the G20 “Shanghai agreement”.
• The latest panic.
Each previous panic was dealt with by governments and—more importantly —central banks, including the Chinese central bank, ganging up to stop the rout. However, given the current chill in relations between Washington and Beijing over trade and technology, it is hard to believe that the latest episode will be halted thanks to a cozy cooperation deal between Donald Trump and Xi Jinping.
So what should investors do? My immediate advice would be to do very little right now. Acting in the middle of a panic is seldom a good idea. I would just continue selling bonds, and so raising cash.
Structurally, I maintain my call to hedge the equity risk in a portfolio with gold, since bondholders are most likely to be the victims of the next crisis. Indeed, I believe that in the next crisis, trading in some bond markets may be discontinuous, as in Argentina in recent days (see Lessons From The Argentine Shock). In the coming crisis, I fear there may be very little to choose between some European bond markets and Argentina.
Investors who believe the Hong Kong situation will not deteriorate further (see Hong Kong Q&A (Part II)) should hold on to their Chinese bonds (over the last 12 months, the 10-year Chinese government bond is up 7% in US dollar terms, handsomely outperforming the total returns on both one-year US T-bills and the S&P 500). And they should concentrate their equity holdings in high quality stocks relatively immune from the vagaries of governments, and hedge them with gold. Praying might also help.
Actually, gold also hedges deflation. The one thing it does not hedge, in the short term, is a genuine market panic which crashes stocks. That tends to lead to a safe haven bid in the USD and smack gold.
I see four swords of Damocles hanging over the equity market and ready to swing:
Advertisement
Hong Kong Tienanmen;
hard Brexit;
trade war deterioration, and
an oil crash.
Bond yields are picking up on all four and so are central banks. Equities are only watching the latter.
When one sword falls then all heads roll, including the Australian dollar.
David Llewellyn-Smith is Chief Strategist at the MB Fund and MB Super. David is the founding publisher and editor of MacroBusiness and was the founding publisher and global economy editor of The Diplomat, the Asia Pacific’s leading geo-politics and economics portal.
He is also a former gold trader and economic commentator at The Sydney Morning Herald, The Age, the ABC and Business Spectator. He is the co-author of The Great Crash of 2008 with Ross Garnaut and was the editor of the second Garnaut Climate Change Review.