

By Chris Becker
The US earnings season has had a hiccup as Trump puts his foot in his mouth again with a threat of more tariffs on China, while a missive to start negotiating with the Iranians has seen the oil price drop over 2% as the USD lifted. The latest US retail sales number overshadowed the slump in manufacturing (plus more plants closing in the US and moving to Europe, China et al) while the closely watched German ZEW survey slumped on both current conditions and forward expectations.
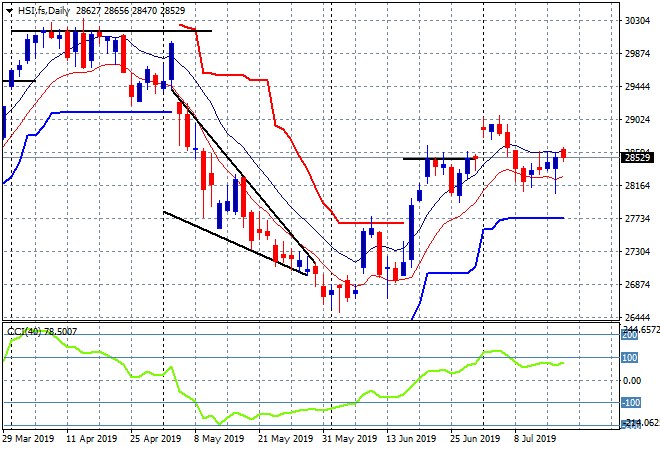
Looking at the action in Asia yesterday first, where the Shanghai Composite continued its slow start to the week, falling 0.2% to close at 2937 points while the Hang Seng Index closed up 0.2% to 28619 points, trying to maintain itself above the previous set of highs at 28500. With support firm at 28000, the market is poised to breakout here, so I’m still watching the high moving average level at 28600:
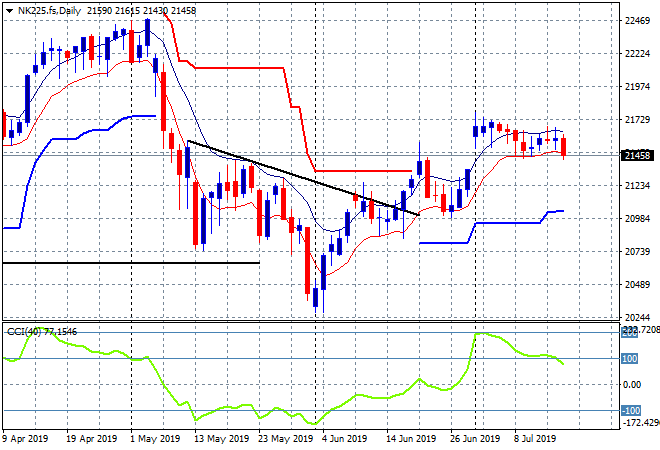
Japanese share markets reopened and sold off immediately, with the Nikkei 225 closing 0.6% lower to 21535 points, despite a falling Yen throughout the session. Note how the daily chart is now faintly signalling a series of lower lows with price bunching around support at the 21400 point level. Despite a stronger USDJPY pair overnight that usually correlates with Japanese stocks, this is looking ripe for a rollover:
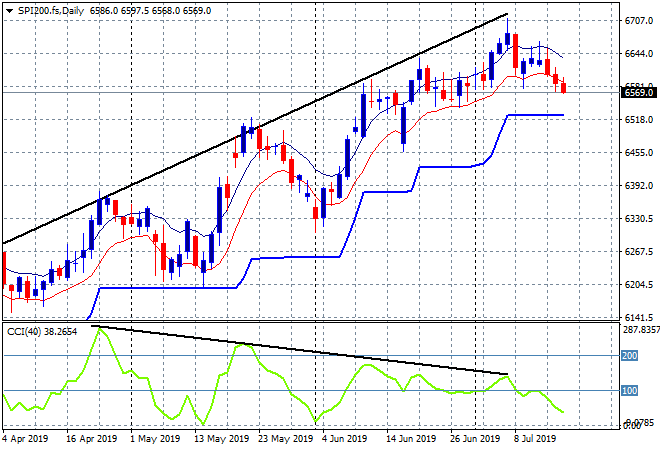
The ASX200 couldn’t gain any traction with another losing session, down 0.2% to 6641 points, again mainly due to bank stocks with AMP the biggest loser as it scraps its dividend. SPI futures are down about 13 points, with the daily chart continuing to suggest a possible dip here as the momentum divergence grows stronger:
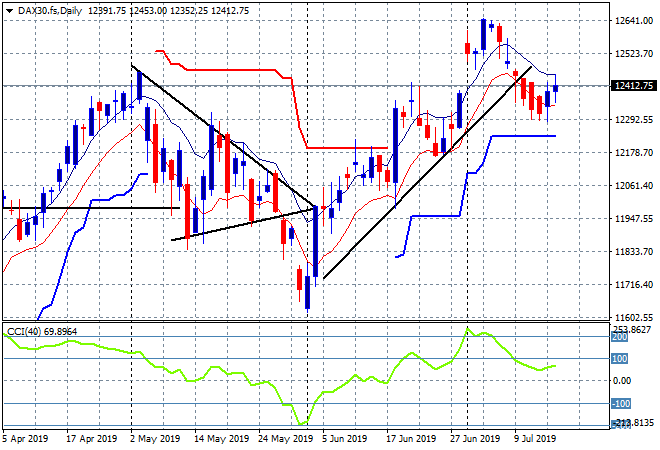
European stocks have rebounded, helped by much lower domestic currencies – particularly Pound Sterling, although for the wrong reasons – with the FTSE up 0.6% while the German DAX which lifted 0.3% in a very solid session to finish at 12430 points, despite the poor ZEW Survey. The daily chart is fighting against a wider retracement down to ATR support at the 12200 point level and is not out of the woods yet. Price needs to get back above the high moving average and then the former trendline:
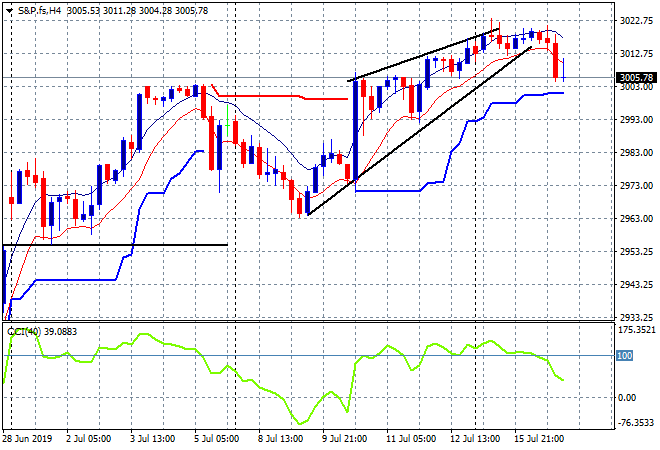
Wall Street stumbled however on Trump’s comments plus the poor showing in earnings with the S&P500 closing 0.3% lower to 3004 points. The four hourly chart had been showing a lot of hesitation here as a bearish rising wedge pattern took shape, and now I’m watching the psychologically important level at 3000 – which is also ATR support – for signs of a greater selloff:
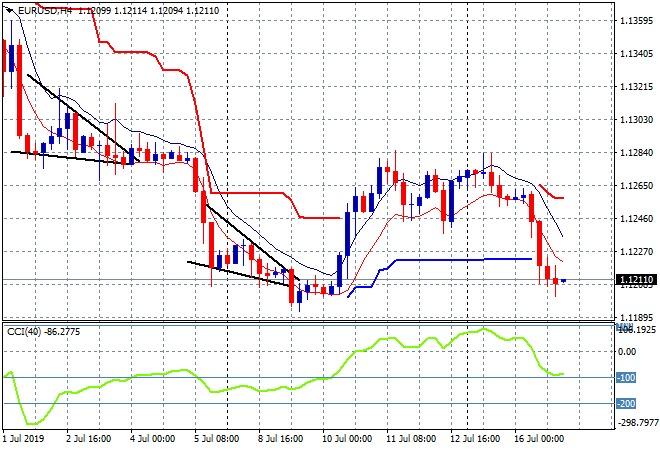
Currency markets finally moved to a USD strength meme, with Pound Sterling collapsing on Boris Johnsons comments while the Euro slumped to finish just above the 1.12 handle this morning after repeatedly failing to get back above last week’s high nearer the 1.1270 level. This may well be over before it finishes with a classic deceleration into last weeks low area so I’m watching just below the 1.12 level for signs of a follow through just in case:
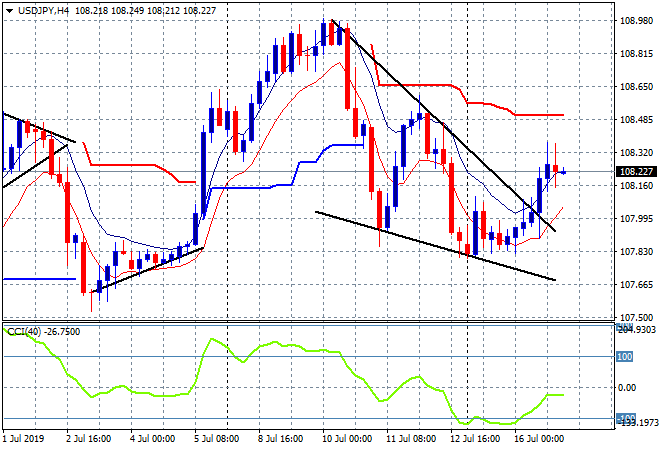
The USDJPY pair broke out if its own wide falling wedge pattern on the four hourly chart, but stalled at the 108.20 to 108.30 level where it could retrace today if risk sentiment continues to reverse. Momentum is not yet positive and overhead ATR trailing resistance not yet broken to call this anything but a short term swing play:
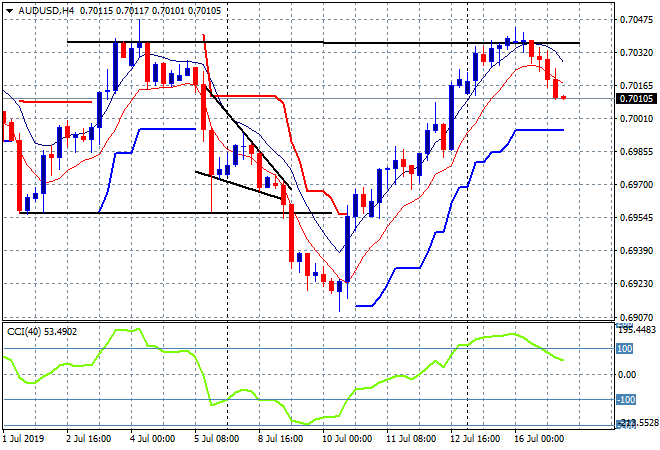
The Australian dollar was looking strong but its own stall has turned into a minor dip, pulling straight back down to the 70 handle overnight. I suggested that this was setting up for a rollover as momentum looked exhausted and quite a crowded trade and ripe for a pullback to ATR support or lower below the 70 cent level:
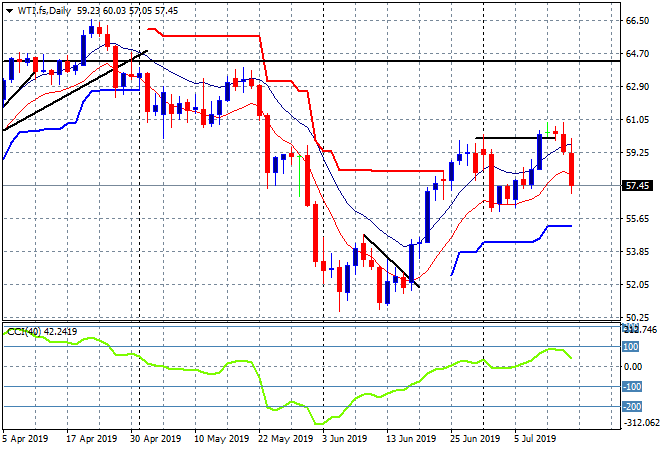
Oil prices fell overnight as the Iranians and Americans had a bit of chat and the hurricane in the Mexican Gulf abated, pushing the WTI contract down more than 2% to well below the $58USD per barrel level. Price had been unable to make a new daily high for almost a week, so momentum was poised to rollover here soon, now I’m watching the previous daily lows at $56 or so for signs of a follow through:
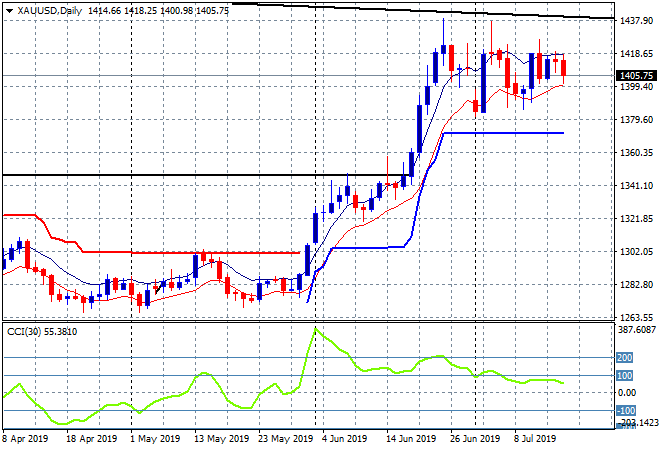
Finally to gold, where intraday volatility remains low and therefore signalling a potential breakout soon. The shiny metal finished slightly lower to the $USD1407 per ounce level overnight in line with other undollar assets. The obvious level to watch here on the upside is obvious at $1420 – if cleared, everyone will pile in:
Glossary of Acronyms and Technical Analysis Terms:
ATR: Average True Range – measures the degree of price volatility averaged over a time period
ATR Support/Resistance: a ratcheting mechanism that follows price below/above a trend, that if breached shows above average volatility
CCI: Commodity Channel Index: a momentum reading that calculates current price away from the statistical mean or “typical” price to indicate overbought (far above the mean) or oversold (far below the mean)
Low/High Moving Average: rolling mean of prices in this case, the low and high for the day/hour which creates a band around the actual price movement
FOMC: Federal Open Market Committee, monthly meeting of Federal Reserve regarding monetary policy (setting interest rates)
BOJ/Abenomics: Bank of Japan, economic policy/direction enacted by PM Shinzo Abe
DOE: US Department of Energy
Uncle Point: or stop loss point, a level at which you’ve clearly been wrong on your position, so cry uncle and get out!