By Cameron Kusher, CoreLogic Research Analyst:
Last week the Australian Bureau of Statistics (ABS) released their biennial Housing Occupancy and Costs data for the 2017-18 financial year. The release has too much data to cover off in full in just one blog post so this week’s blog will cover off on some of the details surrounding housing costs as a share of gross household income.
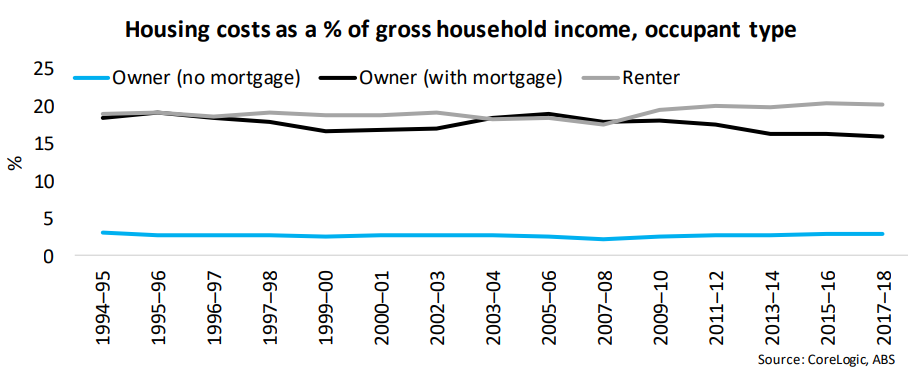
The first chart above highlights housing costs for different type of household occupants over time. Owners without a mortgage see little of their gross household income utilised for housing costs (3.0%) and it has seen very little change over time. Owners with a mortgage are spending 15.9% of
their household income on housing costs and this share has actually been trending lower since it peaked in 2005-06 at 19%. This decline likely reflects the ongoing decline in mortgage rates. While owners have seen housing costs take-up less of their household income over time renters are
spending 20.2% of their income on housing costs. The figure is slightly lower than it was two years earlier however; it shows that housing costs for renters are more expensive than those for owneroccupiers with a mortgage. This likely reflects that renters typically have lower gross household
incomes than those with a mortgage, and that mortgage holders are generally reducing their debt payments over time as they pay down their principal.