Advertisement
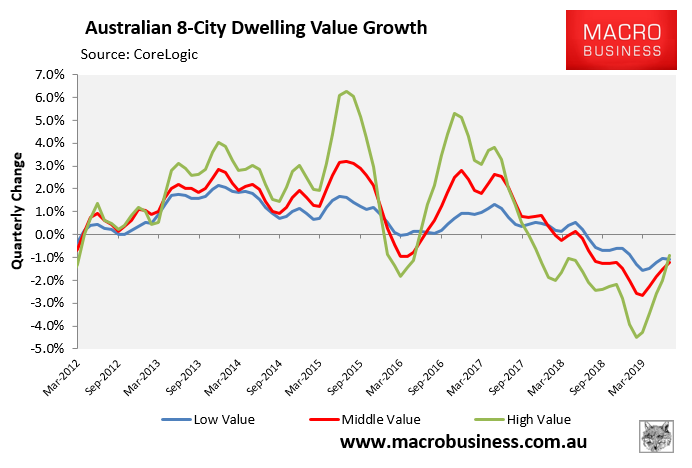
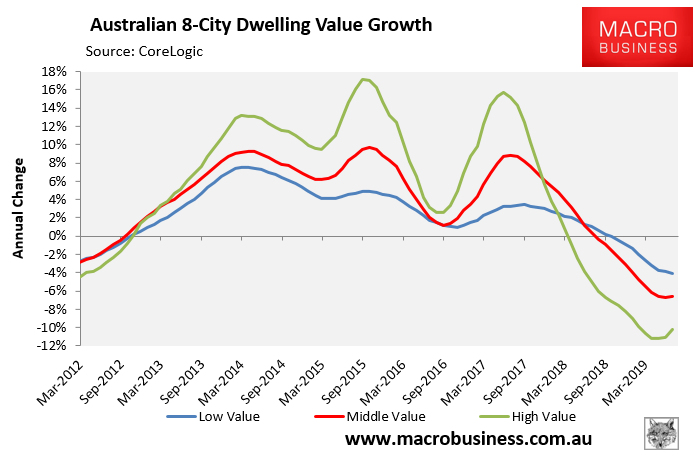
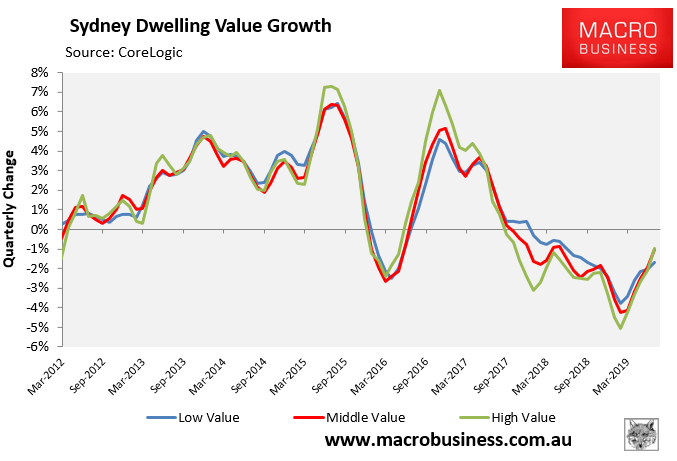
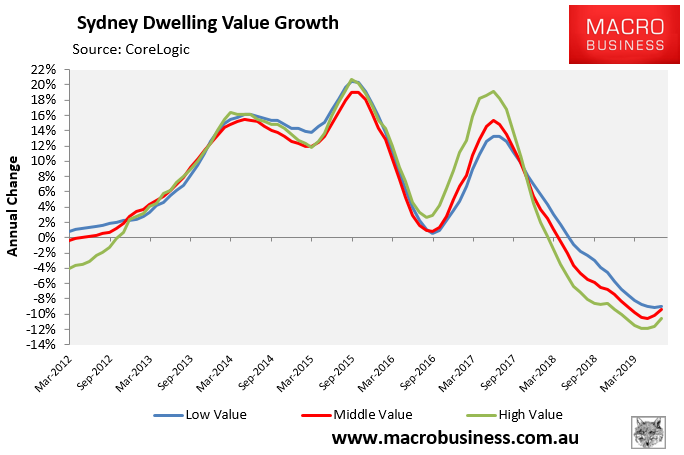
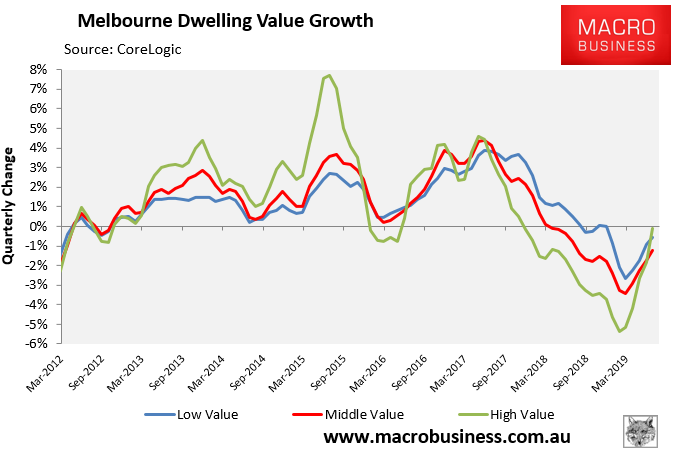
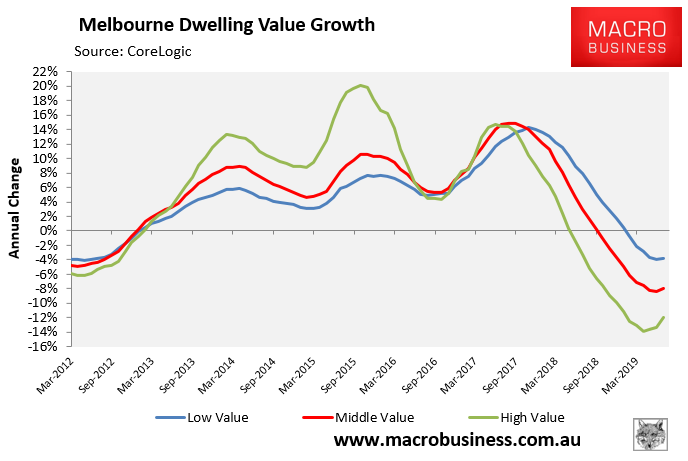
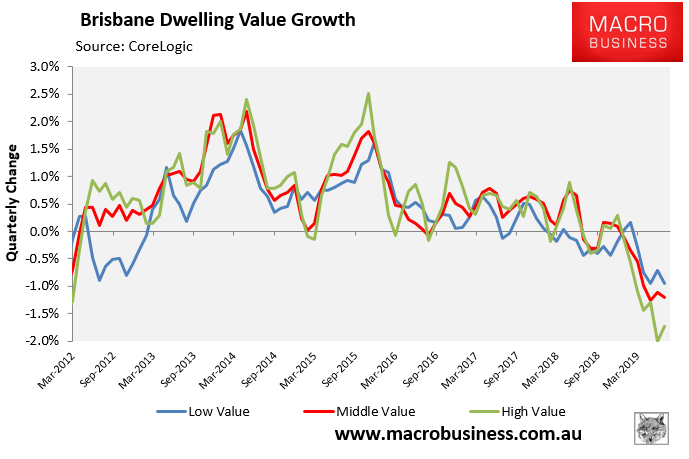
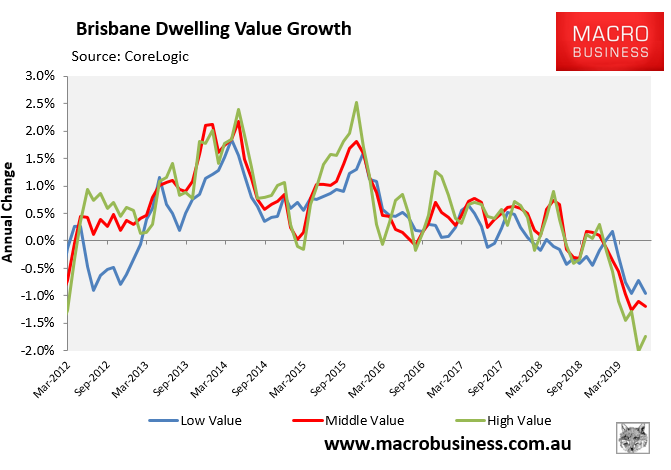
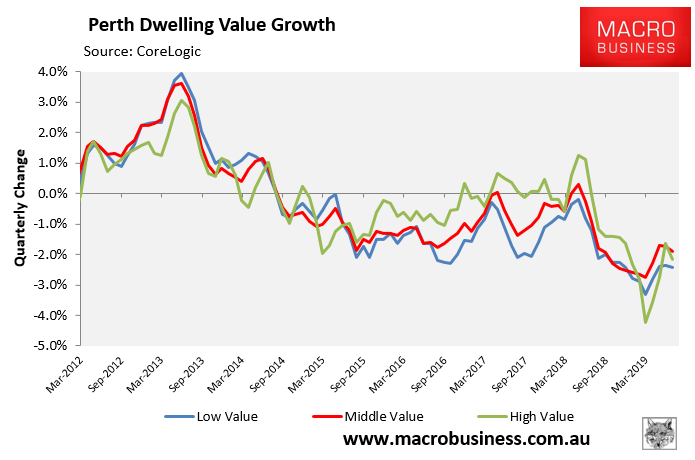
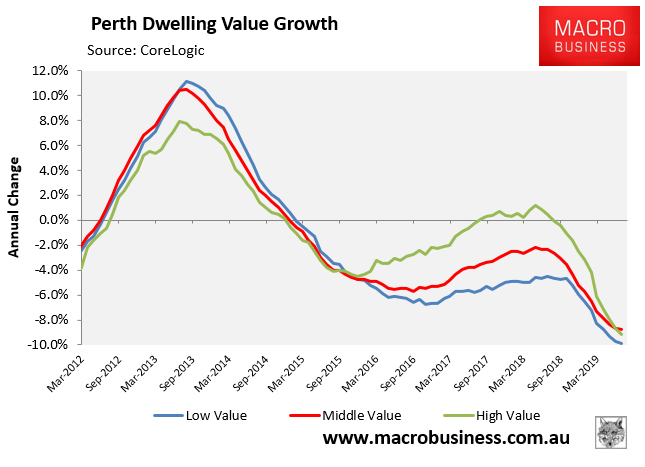
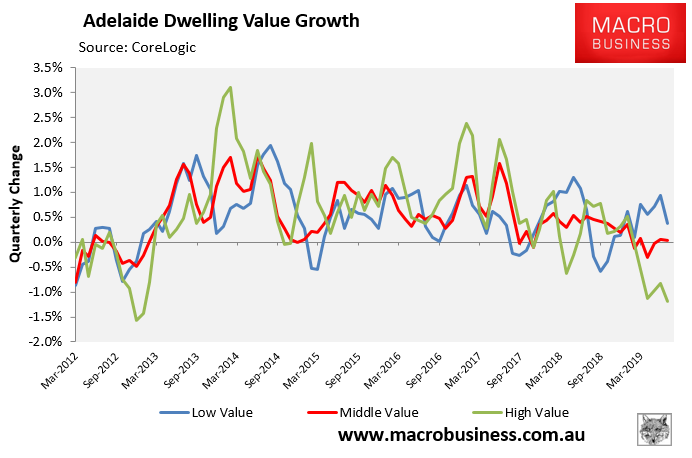
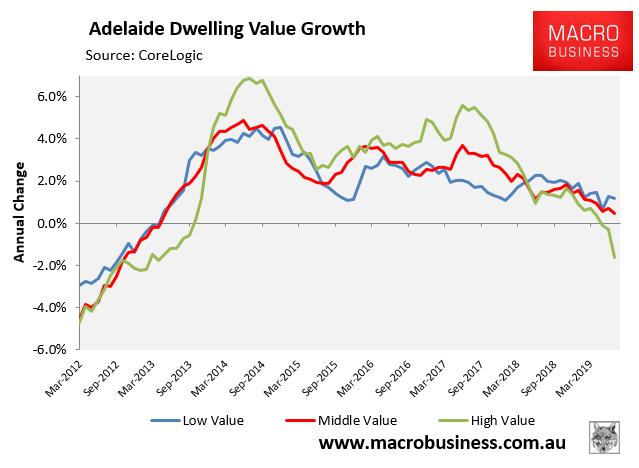
Below is CoreLogic data examining price growth across the three broad market segments – bottom 25%, middle 50% and top 25%. This shows that the most expensive properties have shown the most improvement, in terms of annual price growth, and are leading the nascent price recovery:
National:
Sydney:
Advertisement
Melbourne:
Advertisement
Brisbane:
Perth:
Advertisement
Adelaide:
Advertisement
After experiencing much larger falls than the other two segments (following a larger growth phase), the most expensive segment of the market is seeing its rate of falls slow. This is a trend that has played out before whereby premium housing values fall the fastest initially but also sees the falls cease earlier than other market segments.
The full text of this article is available to MacroBusiness subscribers
Cancel at any time through our billing provider, Stripe
About the author

Leith van Onselen is Chief Economist at the MB Fund and MB Super. He is also a co-founder of MacroBusiness.
Leith has previously worked at the Australian Treasury, Victorian Treasury and Goldman Sachs.