
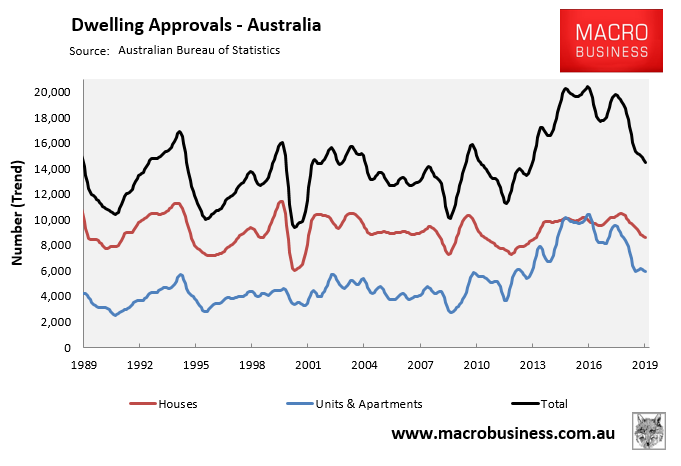
Yesterday, the ABS released dwelling approvals data for June, which revealed that overall dwelling approvals have crashed 28.5% since their May 2016 peak, with house approvals down 18% from peak and apartment approvals down 43% from peak:
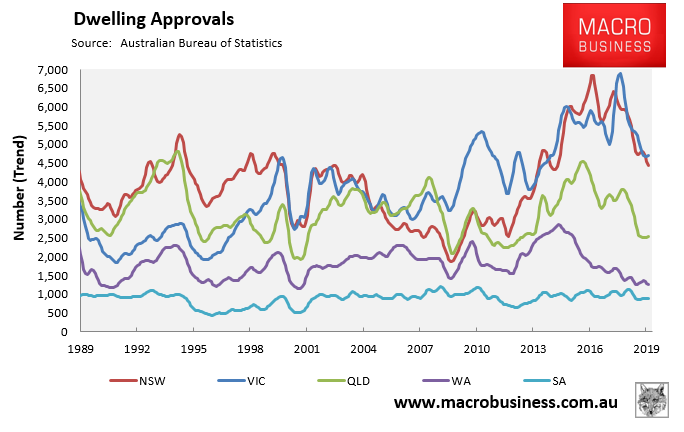
Moreover, approvals have crashed across all major markets, with NSW down 35% from peak, VIC down 32%, QLD down 48%, WA down 56% and SA down 35%:
Advertisement
To add further colour, below are charts plotting the breakdown of approvals by type for each of the states and territories, which are presented below in rolling annual terms to smooth volatility.
