
Advertisement
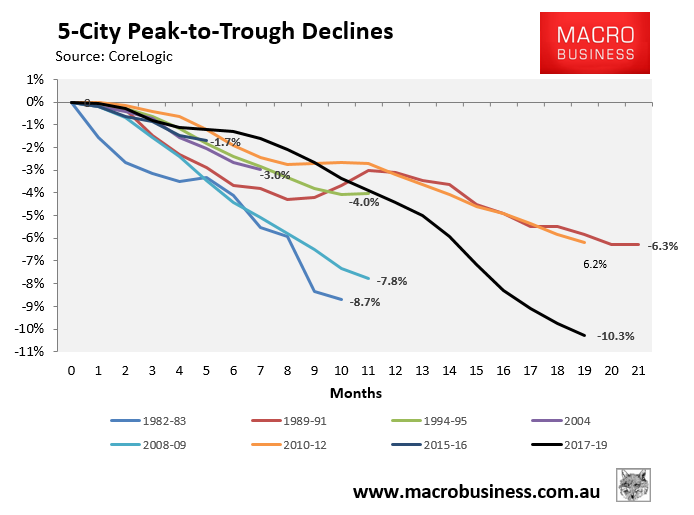
With Australia’s housing correction now dragging on for 19 months, and peak-to-trough declines totalling 10.3% at the 5-city level, it’s an opportune time to compare this correction with prior episodes.
The below chart shows the various dwelling corrections over the past 30-plus years at the 5-city level, as measured by CoreLogic:
Advertisement
The full text of this article is available to MacroBusiness subscribers
Cancel at any time through our billing provider, Stripe
About the author

Leith van Onselen is Chief Economist at the MB Fund and MB Super. He is also a co-founder of MacroBusiness.
Leith has previously worked at the Australian Treasury, Victorian Treasury and Goldman Sachs.
Advertisement