The new RBA Financial Stability Review is out and brimming with anxiety:
Risks to the household sector have increased over the past six months given weak housing market conditions. Housing prices have fallen significantly in Sydney and Melbourne after the earlier large run-up in prices, while in Perth and other miningexposed regions, prices have been declining for several years. However, nationally, only a small share of borrowers have seen the value of their property fall below the value of their loan. Improved lending standards over recent years have supported this outcome. If there were further large housing price falls, the share of borrowers in negative equity would increase significantly. Even then, negative equity need not be problematic for financial stability as long as the unemployment rate remains low and households continue to be able to repay their debt.
Households are currently well placed to meet their debt obligations given low unemployment. Indeed, households have continued to make substantial voluntary repayments on their loans, albeit at a slower rate. Indicators of financial stress remain low outside the mining-exposed regions. However, the value of housing loans in arrears has drifted up from very low levels.
The risks associated with housing would increase with a rise in the unemployment rate or further substantial price declines. With weak housing market conditions, borrowers experiencing difficulties making loan repayments find it harder to resolve their situation by selling their properties. Housing constitutes a large share of households’ wealth and further large declines in housing prices could cause households to pull back on consumption, particularly for those who are highly leveraged. This, in conjunction with falling dwelling investment, could add to rising unemployment. Such a scenario would have adverse consequences for financial stability to the extent that it increases both households’ likelihood of default and the losses banks would experience in the event of default.
Housing price declines also increase settlement risk for apartments sold off the plan. If valuations at settlement are below the contracted sale price, some buyers may find it harder to obtain finance and some purchases could fall through. However, as discussed in ‘Box C: Risks in High-density Apartment Markets’, settlement failures remain low to date. Further, some larger and diversified developers have low gearing and can afford to hold some unsold stock.
Commercial property valuations continue to rise much faster than rents. As discussed in Chapter 1, low long-term interest rates have underpinned high asset valuations globally, which could reverse suddenly with increased risk aversion or a jump in expected inflation. Highly leveraged owners of commercial property experiencing falls in valuations could breach loan covenants, which could result in sales and further price falls. In Sydney and Melbourne office markets, vacancy rates are low and rents are rising, minimising these risks for now. In contrast, risks related to retail property markets have risen somewhat given weaker trading conditions over recent quarters and the subdued outlook for household consumption.
Household debt remains high but most indebted households can afford their debt repayments
Although lending standards have improved and housing credit growth has slowed, the ongoing high level of aggregate household indebtedness remains a key vulnerability. Highly indebted households are a key risk to financial stability since they are more susceptible to falling behind on their repayments in the event of an adverse shock to their ability to service their loans (for example, rising interest rates or unemployment).
Highly indebted households may also be more likely to reduce their spending if macroeconomic conditions deteriorate. This could amplify the impact of any downturn. Most households are well placed to service their debt. However, the distributions of debt and prepayment buffers are uneven across households and, accordingly, a small share of borrowers remain relatively vulnerable.
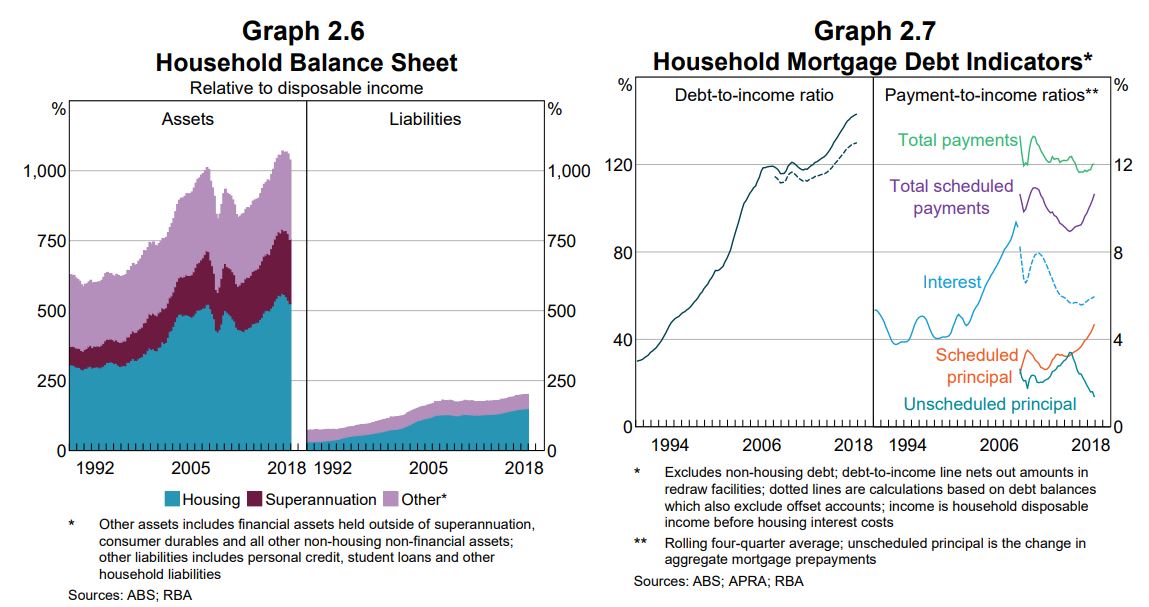
Despite housing price falls, household gearing levels are low in aggregate. Total assets are five times larger than the stock of liabilities (Graph 2.6). Around one-third of households own their own home outright, which contributes to the low aggregate gearing ratio. Estimates suggest that fewer than 5 per cent of households have gearing ratios greater than 80 per cent. This small share of households are most exposed to the recent decline in housing prices because they require smaller price falls to tip them into negative equity than less leveraged borrowers. However, estimates and liaison with banks suggest that the share of households currently in negative equity is low (see ‘Box B: Housing Price Falls and Negative Equity’).
Households’ total repayments on housing debt have been broadly stable as a share of household income over recent years. However, a greater share of these repayments are required rather than voluntary. Interest payments as a share of income have picked up a little given recent modest increases in mortgage interest rates. More notable, though, is that payments of scheduled principal are accounting for an increasing share of household income (Graph 2.7). The increase in scheduled principal repayments reflects a combination of factors including rising debt, an increase in the share of loans repaying principal (as the stock of IO loans has declined) and a modest ageing of the loan pool (older loans pay proportionally more principal). Rising scheduled principal payments have recently occurred at the same time that unscheduled principal, or ‘voluntary’ prepayments, have declined. Households are still making additional principal payments of around 1¼ per cent of income, although this is down from 3½ per cent in 2015.
The aggregate stock of mortgage prepayments remains large. The stock of prepayments (the sum of balances in offset accounts and redraw facilities) accounts for 161/2 per cent of the gross stock of housing credit or a bit over 2½ years of repayments at current interest rates (Graph 2.8). But nearly 30 per cent of loans have no or little buffer, and so appear more vulnerable. Many of these have disincentives to prepay (fixed rate and investor loans) and so borrowers may be accumulating savings outside of their mortgage products. Another, smaller, share of loans with no buffers are new loans that have had little time to accumulate prepayments. Most of this latter group of loans may be expected to build prepayments over time, though they remain relatively vulnerable in the near term. With slower credit growth, the share of new loans with no buffer is likely to decline further.
Interesting to note that the RBA has shifted focus from the supposedly hunky dory distribution of debt to the vulnerability at the margins, which it should have done long ago. That may have been pushed upon them by the recent IMF material which did the same.
But most interesting, and unsettling, is a little breakout box in which the RBA looks into its RMBS dataset:
Advertisement
Large housing price falls in parts of Australia mean some borrowers are facing negative equity – where the outstanding balance on the loan exceeds the value of the property it is secured against. Negative equity creates vulnerabilities both for borrowers and lenders. A borrower having difficulty making loan repayments who has negative equity cannot fully repay their debt by selling the property. Negative equity also implies that banks are likely to bear losses in the event that a borrower defaults. Evidence from Australia and abroad suggests that borrowers who experience an unexpected fall in income are more likely to default if their loan is in negative equity.
At present, the incidence of negative equity remains low. Given the large increases in housing prices that preceded recent falls and the decline in the share of mortgages issued with high loan-to-valuation ratios (LVRs), housing prices would need to fall significantly further for negative equity to become widespread. However, even if this did occur, increased defaults would be unlikely if the unemployment rate remains low, particularly given the improvements in loan serviceability standards over recent years.
Few loans are currently in negative equity despite sizeable housing price declines
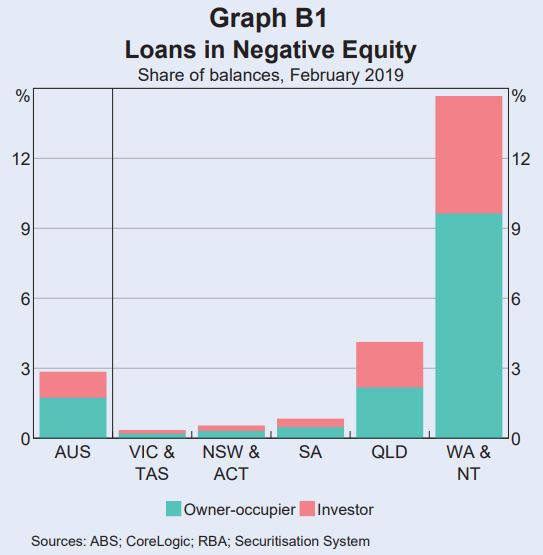
Estimating the share of borrowers with negative equity requires data on current loan balances and property values. The RBA’s Securitisation Dataset contains the most extensive and timely data on loan balances and purchase prices.1 These data can be combined with regional data on housing price movements to estimate the share of loans that are currently in negative equity. This suggests that nationally, around 2¾ per cent of securitised loans by value are in negative equity (just over 2 per cent of borrowers).2 The highest rates of negative equity are in Western Australia, the Northern Territory and Queensland, where there have been large price falls in areas with high exposure to mining activity. Almost 60 per cent of loans in with negative equity are in Western Australia or the Northern Territory. Rates of negative equity in other states remain very low (Graph B1).
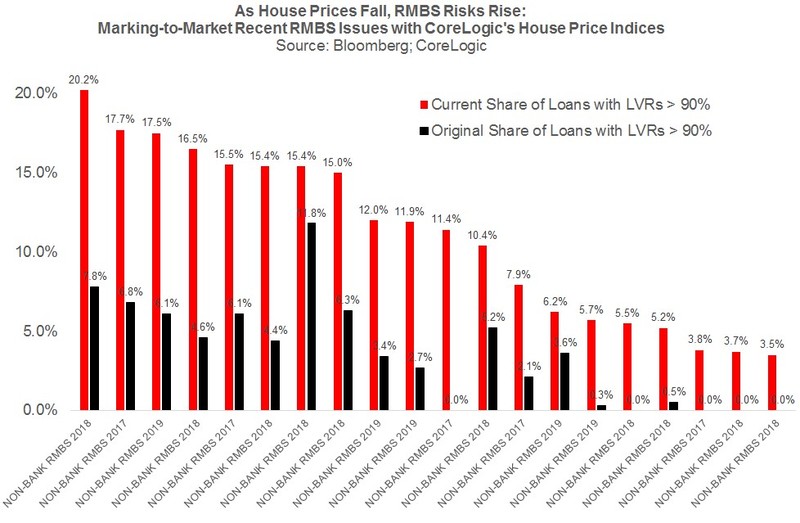
This trails Chris Joye who recently examined 2017 RMBS and found some bonds that were a full 10% underwater:
As house prices fall, the loan-to-value ratios underpinning an RMBS issue rise in lock-step, which reduces the equity protecting the bond. Using Bloomberg data on the current amortised value of the home loans in all Australian RMBS pools, the LVR distribution of the loans, and the geographic location of the properties, we have marked-to-market all the 2017, 2018 and 2019 issues after accounting for the amortisation or pay-down of loans through to the end of February 2019.
What we find is some huge increases in the share of an RMBS issue’s assets with LVRs over 90% compared to the leverage reported when the bond was originally sold to investors (often jumping from 5% of loans to 15% to 20% of loans).
We have also documented some recent RMBS deals where the share of loans that are underwater, or have LVRs over 100%, has increased strikingly, including one transaction where more than 1-in-10 loans appear to be underwater.
…At the same time as the equity protecting RMBS is shrinking, we have demonstrated that RMBS default rates are trending higher back to GFC peaks using our compositionally-adjusted hedonic index of RMBS arrears. This is consistent with the RBA’s data on mortgage arrears, which I have enclosed below our index chart.
There is also the problem of declining mortgage prepayment rates, which is blowing out the expected life of RMBS bonds (adversely impacting assumed credit spreads) as borrowers struggle to prepay loans at the same rate as they have done in the past.
Advertisement
The RBA has weighed the entire stock of Australian RMBS instead and found nearly 3% underwater.
I had a chat with Chris and his view his view is that is quite a big number. It is much higher than arrears rates, and it shows how vulnerable banks are to an unemployment spike.
Moreover, the distribution is worrying. The numbers in WA, NT and QLD are staggering. But south eastern city numbers are also a concern because they are still so low. In part that is the result of the strong price run up but it also raises the prospect of much higher numbers of negative equity ahead as prices continue to fall. Essentially, the half of the market that hasn’t yet gone bust is doing so now.
Advertisement
I very much doubt that RMBS buyers will be comforted by this analysis.
David Llewellyn-Smith is Chief Strategist at the MB Fund and MB Super. David is the founding publisher and editor of MacroBusiness and was the founding publisher and global economy editor of The Diplomat, the Asia Pacific's leading geo-politics and economics portal.
He is also a former gold trader and economic commentator at The Sydney Morning Herald, The Age, the ABC and Business Spectator. He is the co-author of The Great Crash of 2008 with Ross Garnaut and was the editor of the second Garnaut Climate Change Review.