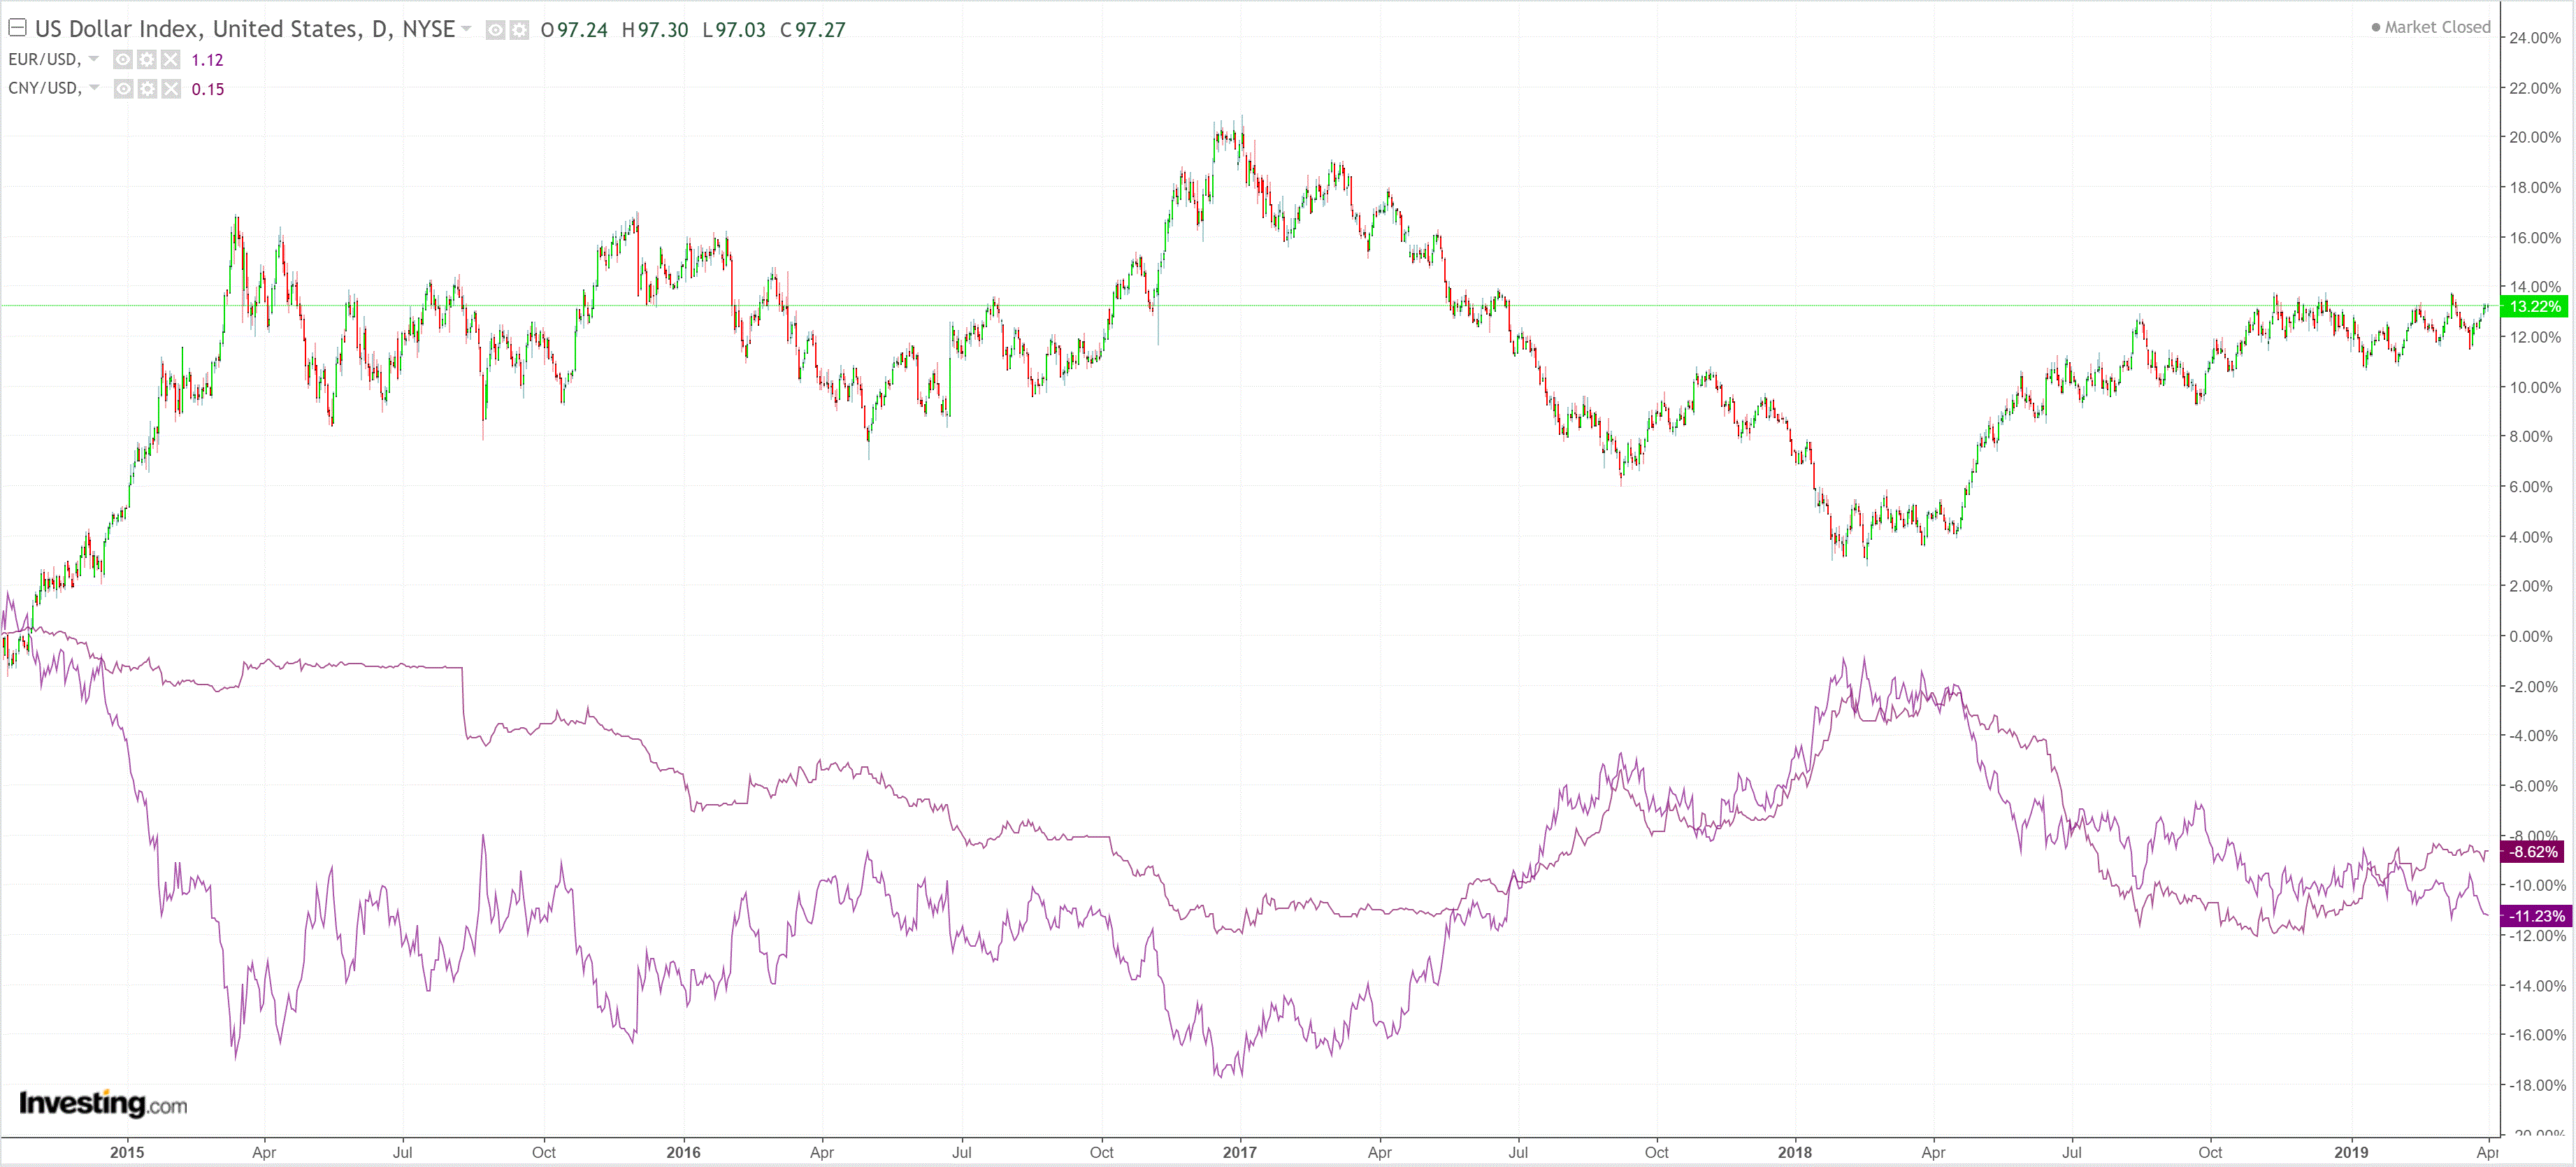
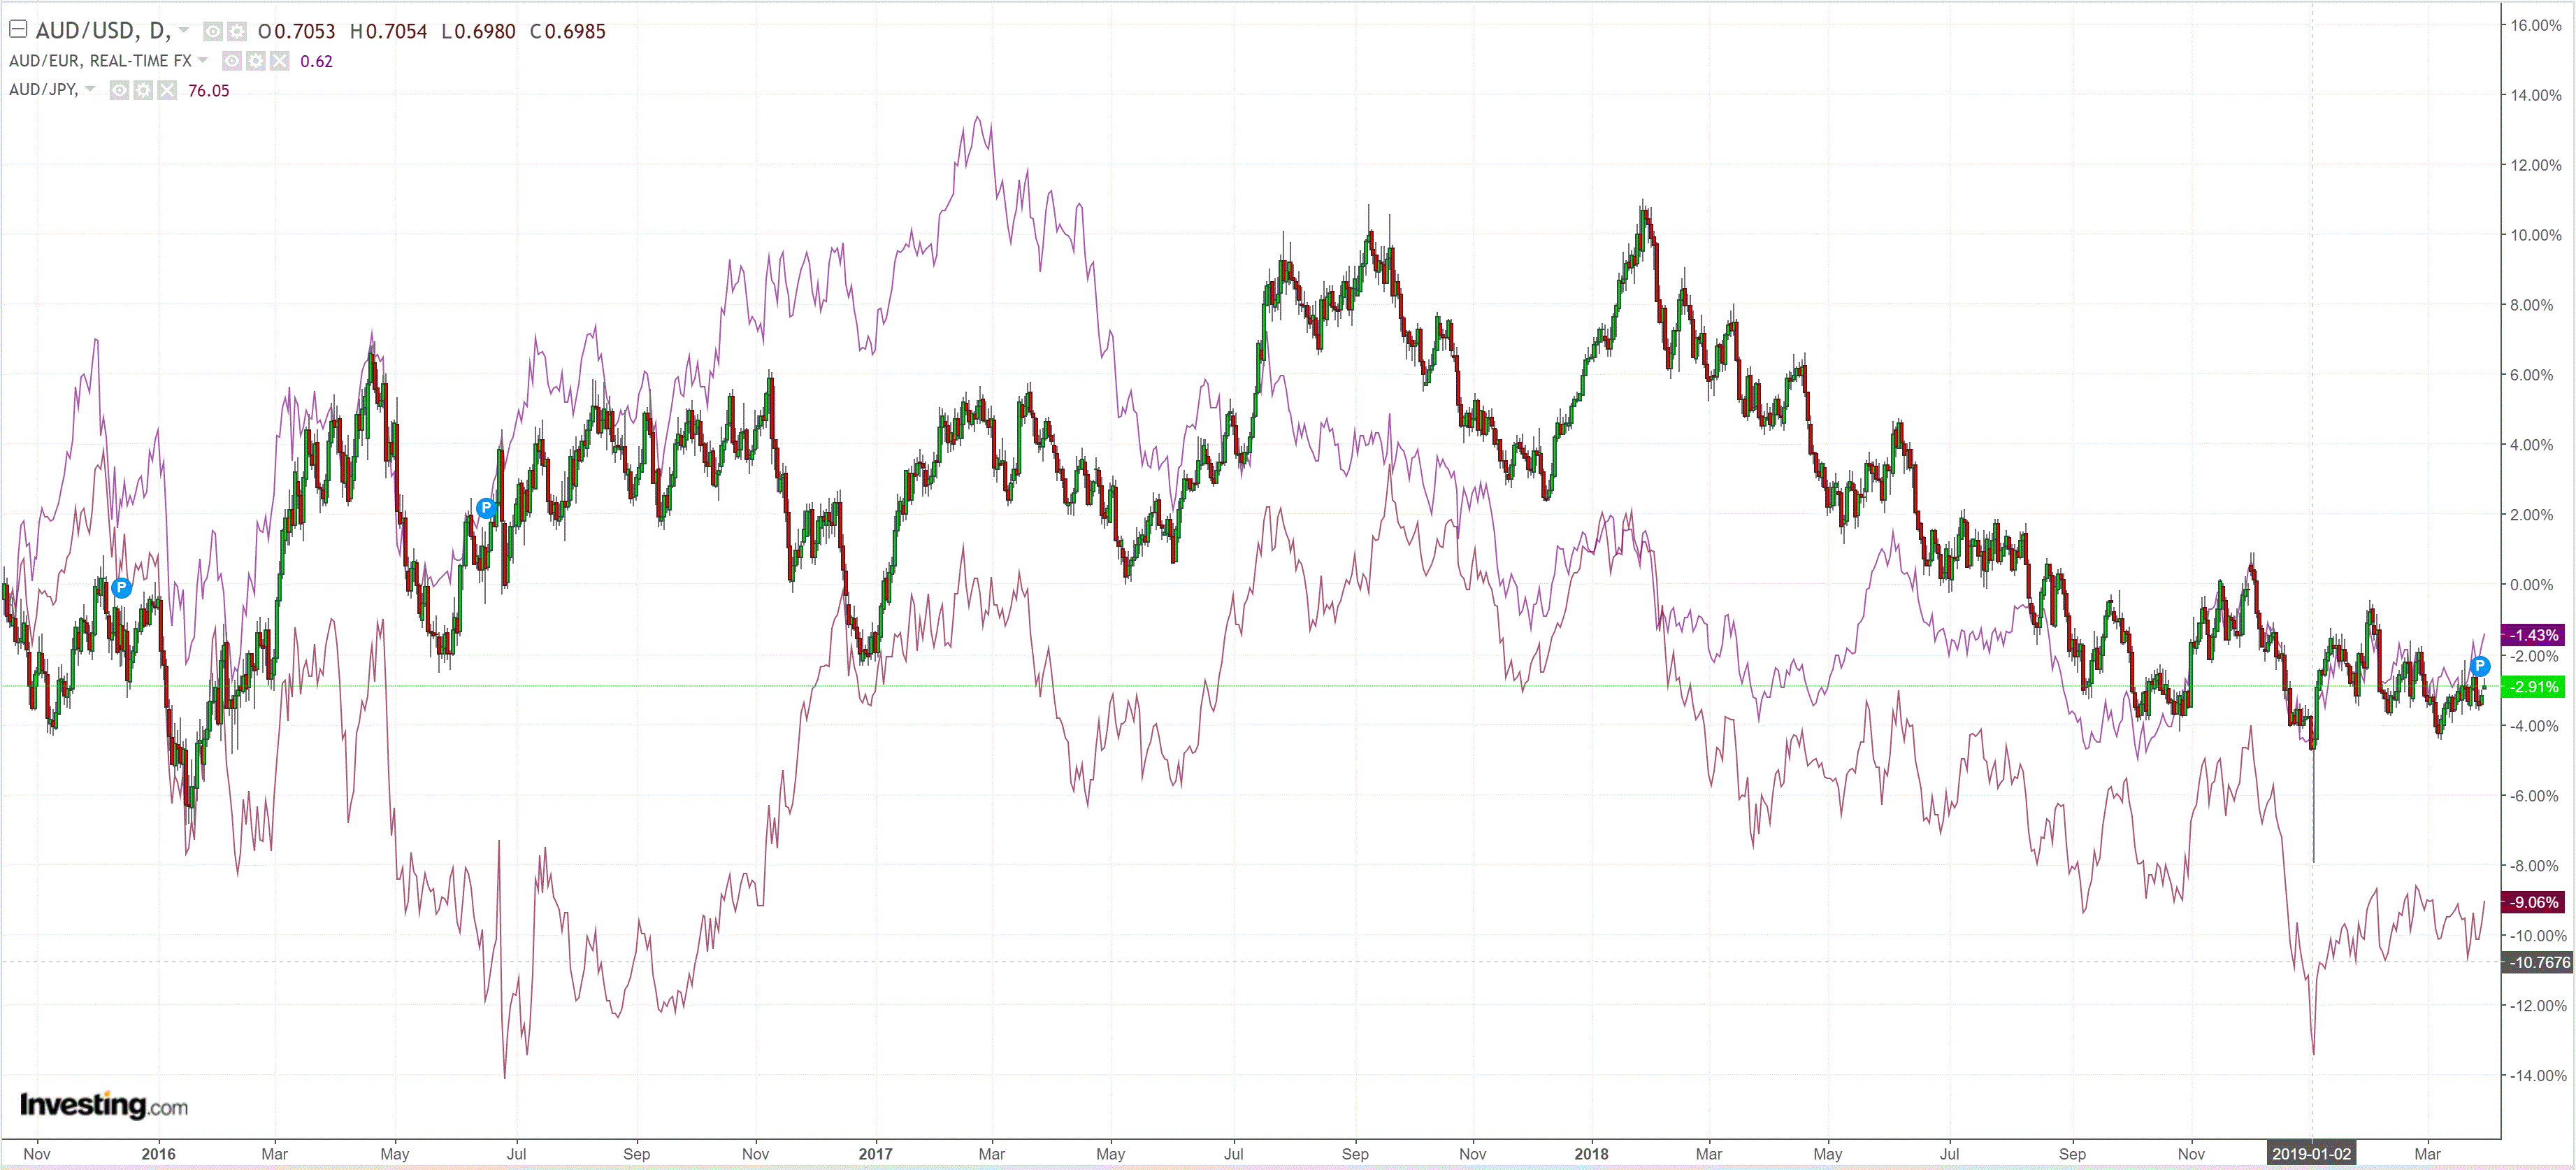
AUD was up across the board but the move was muted:
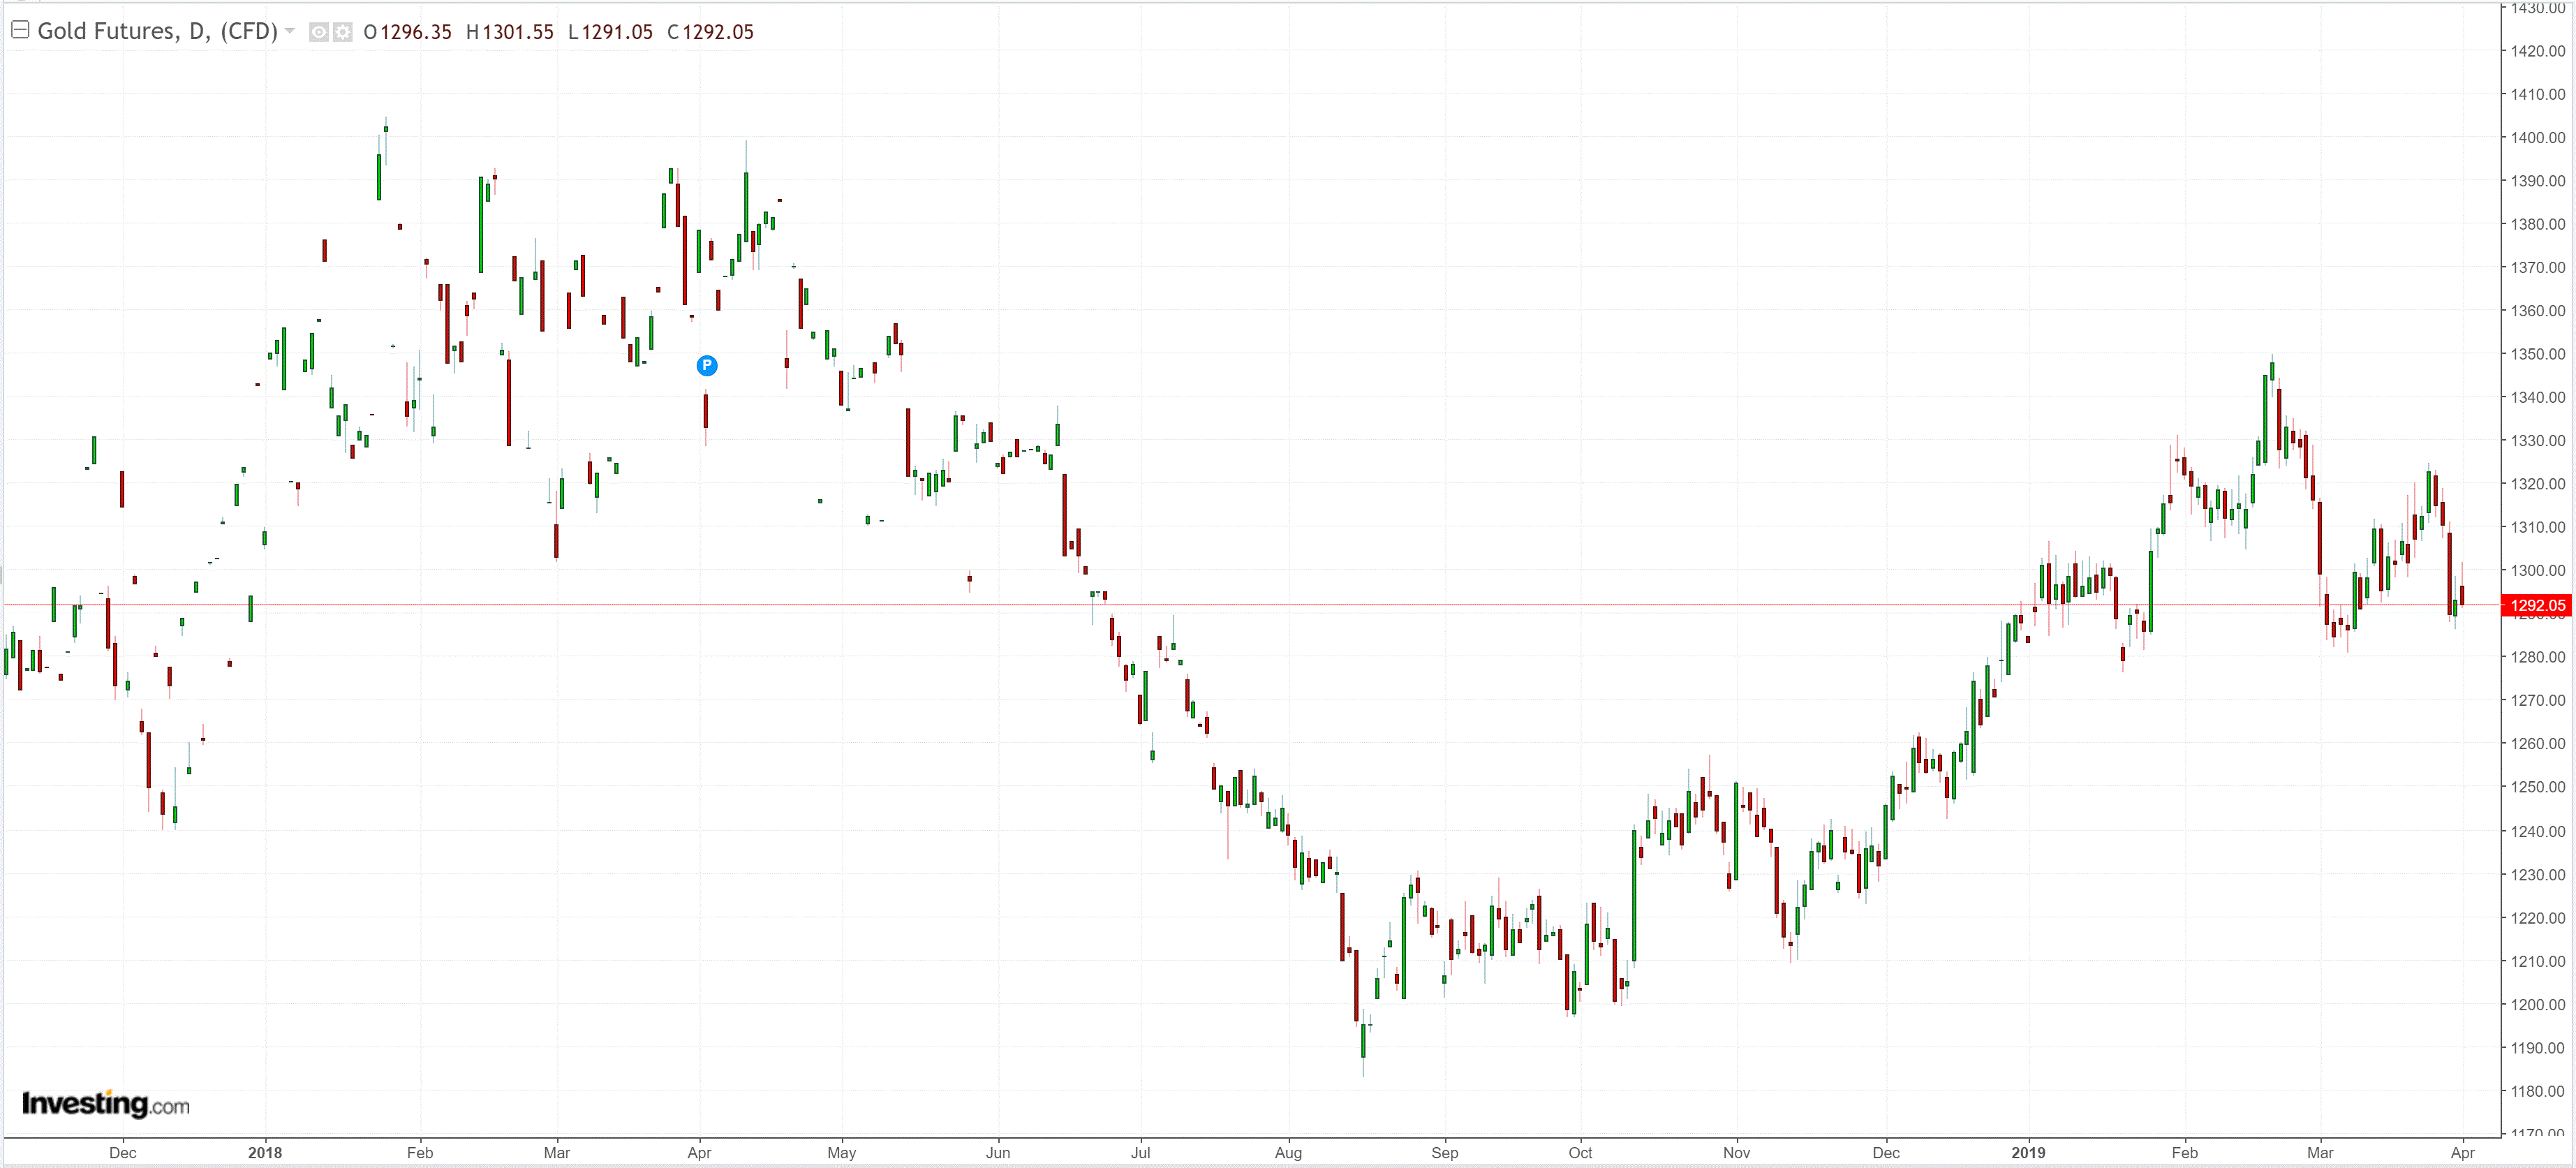
Gold fell:
Advertisement
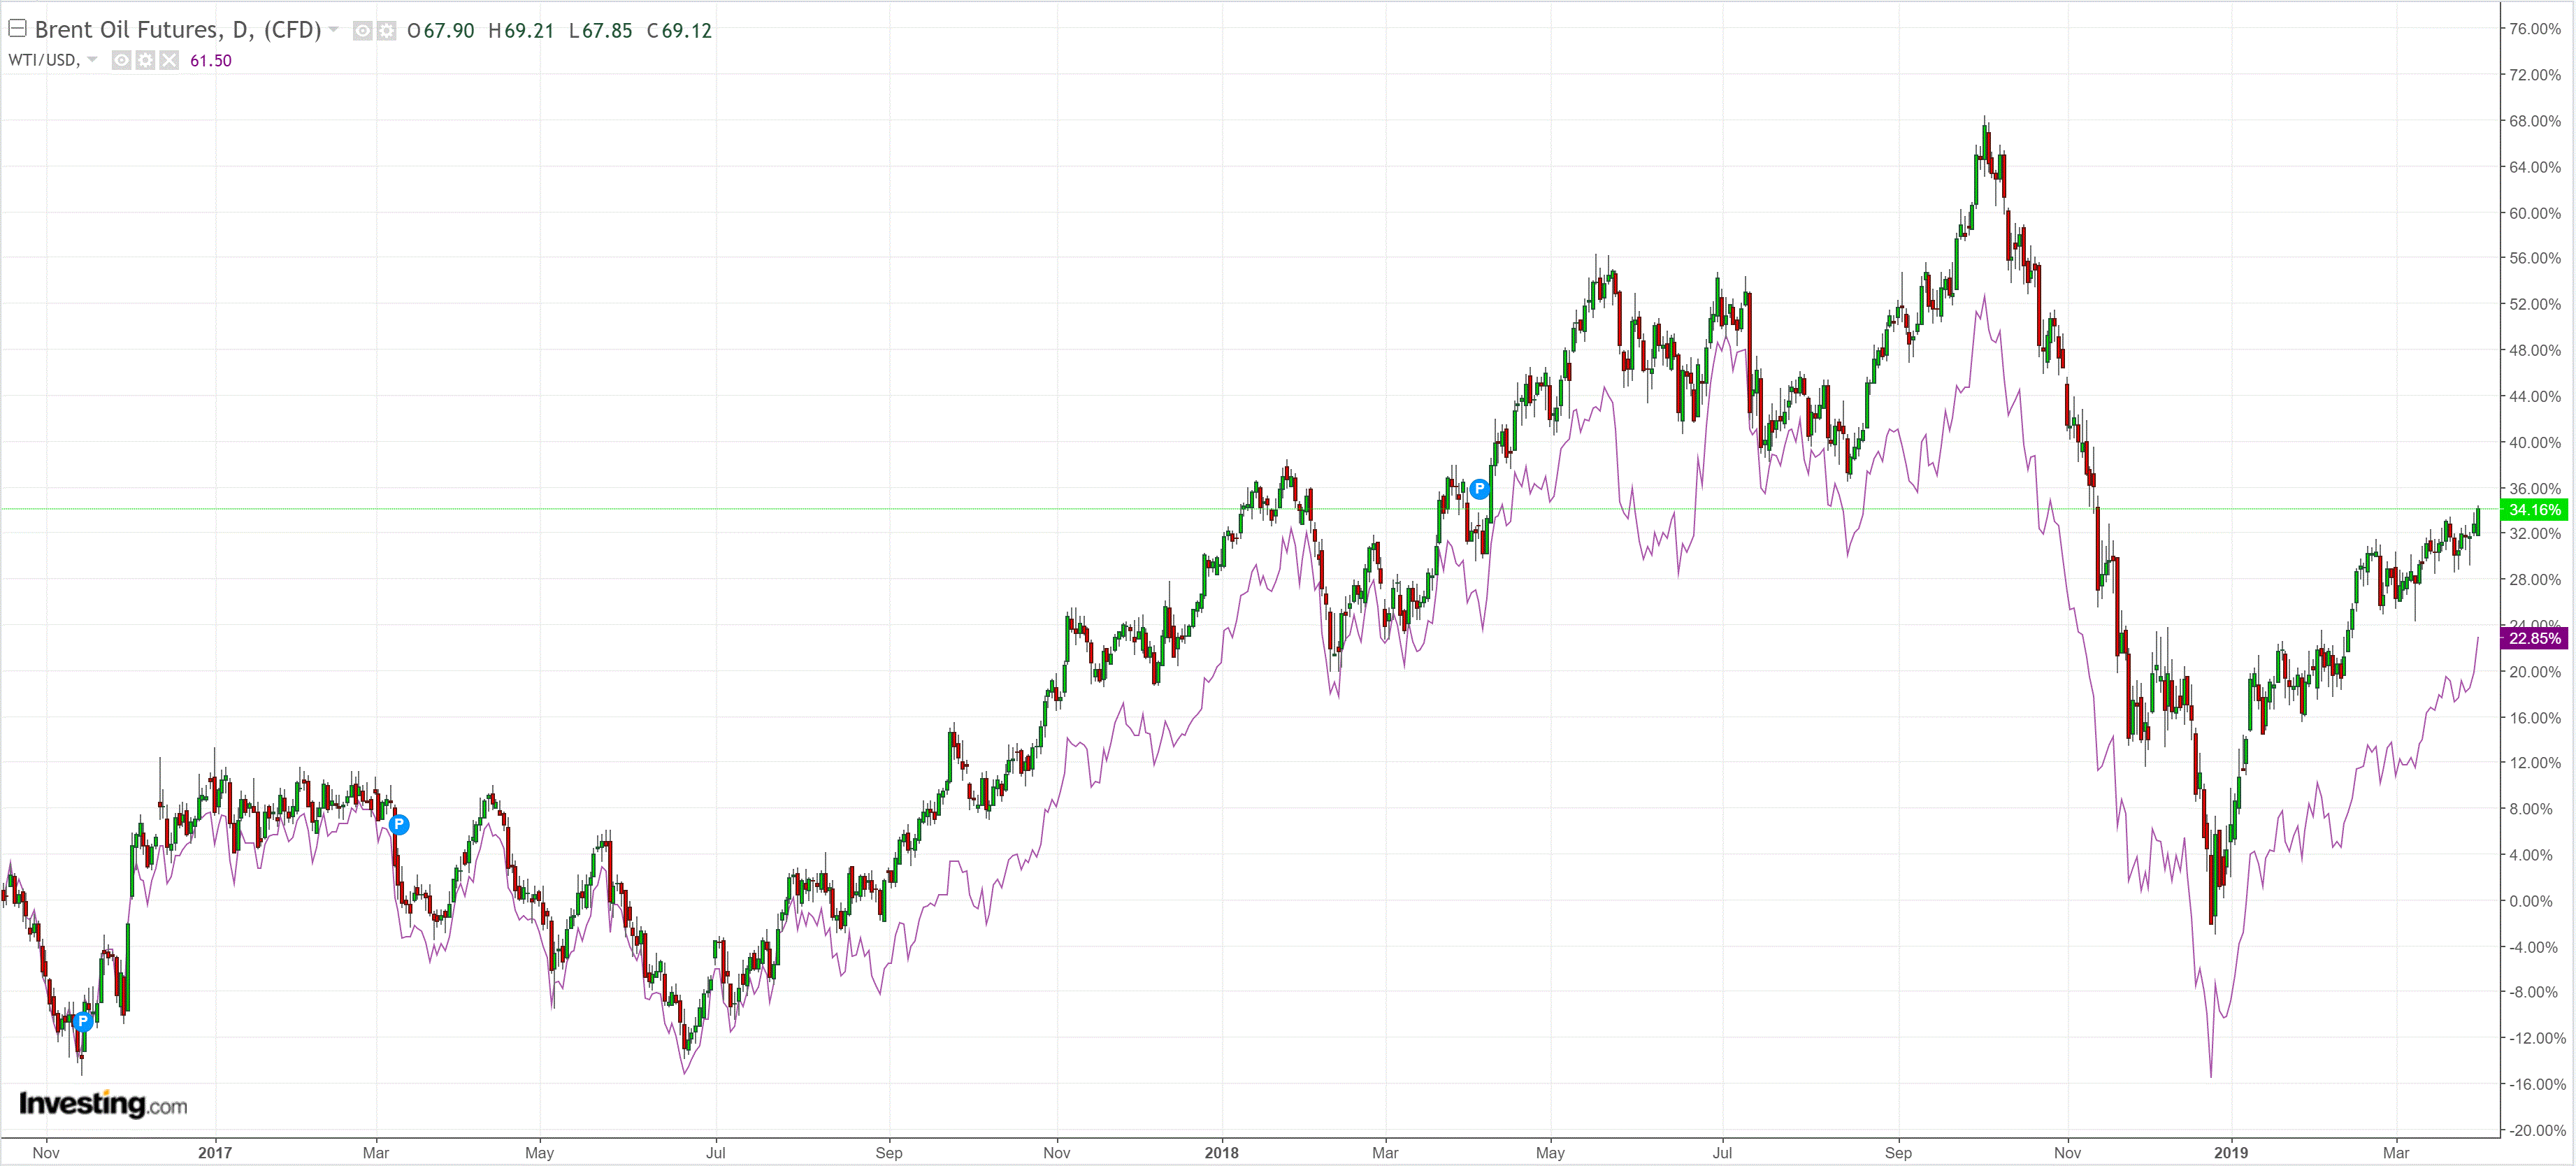
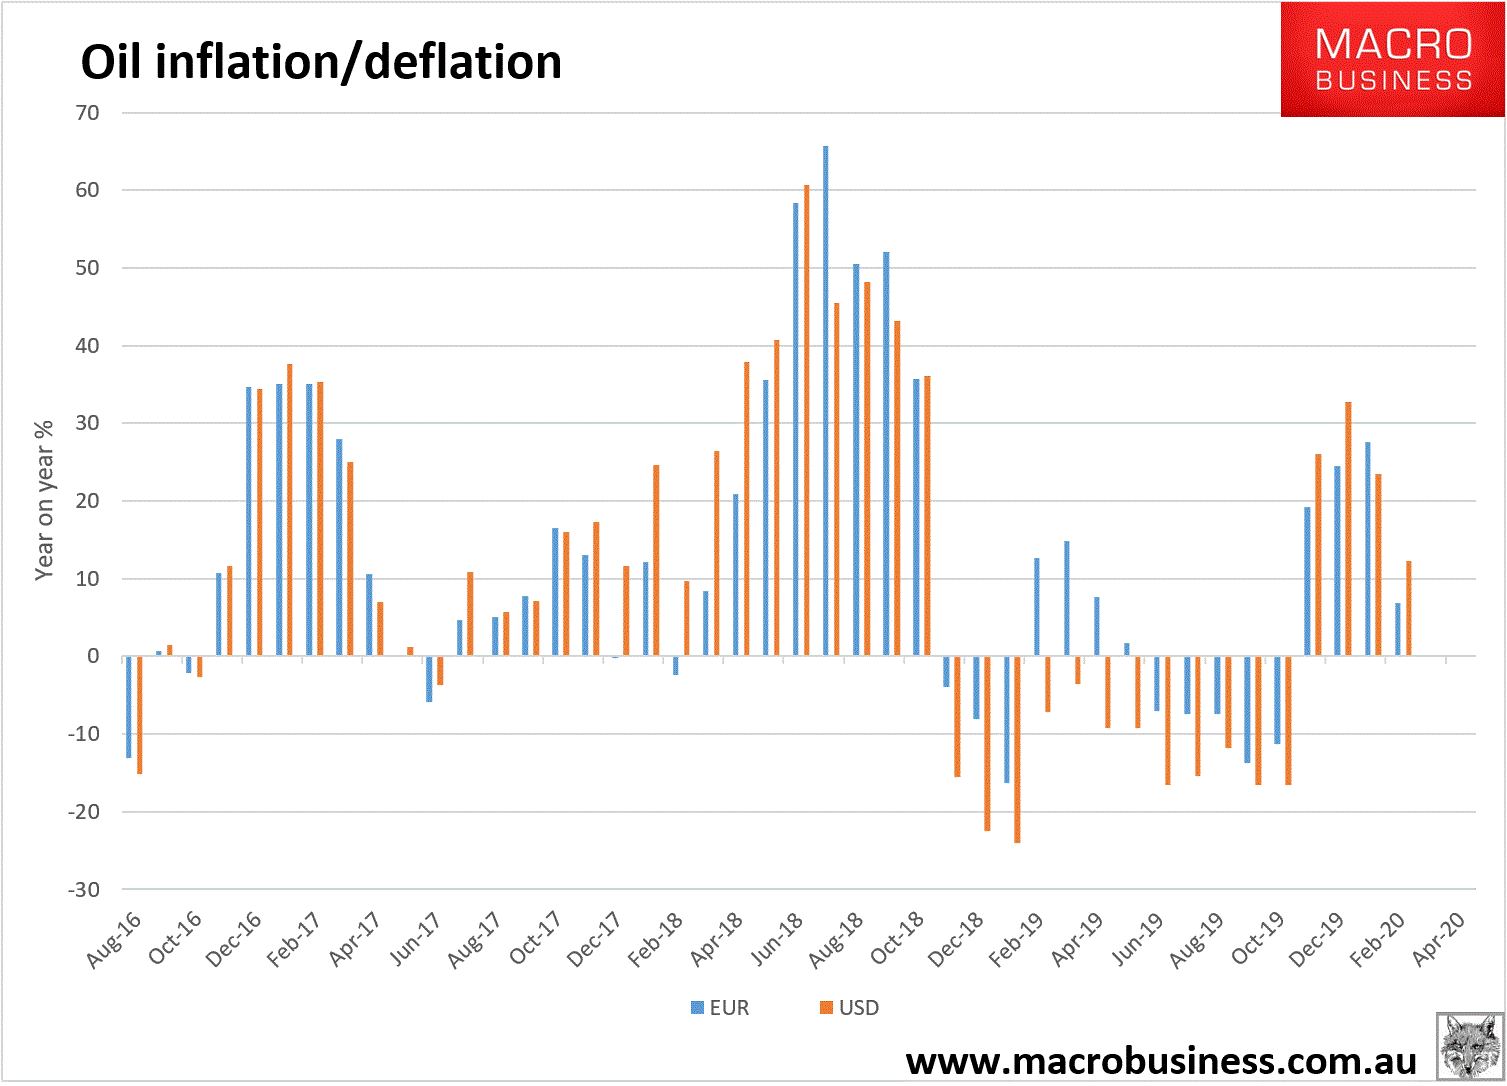
Oil is charging:
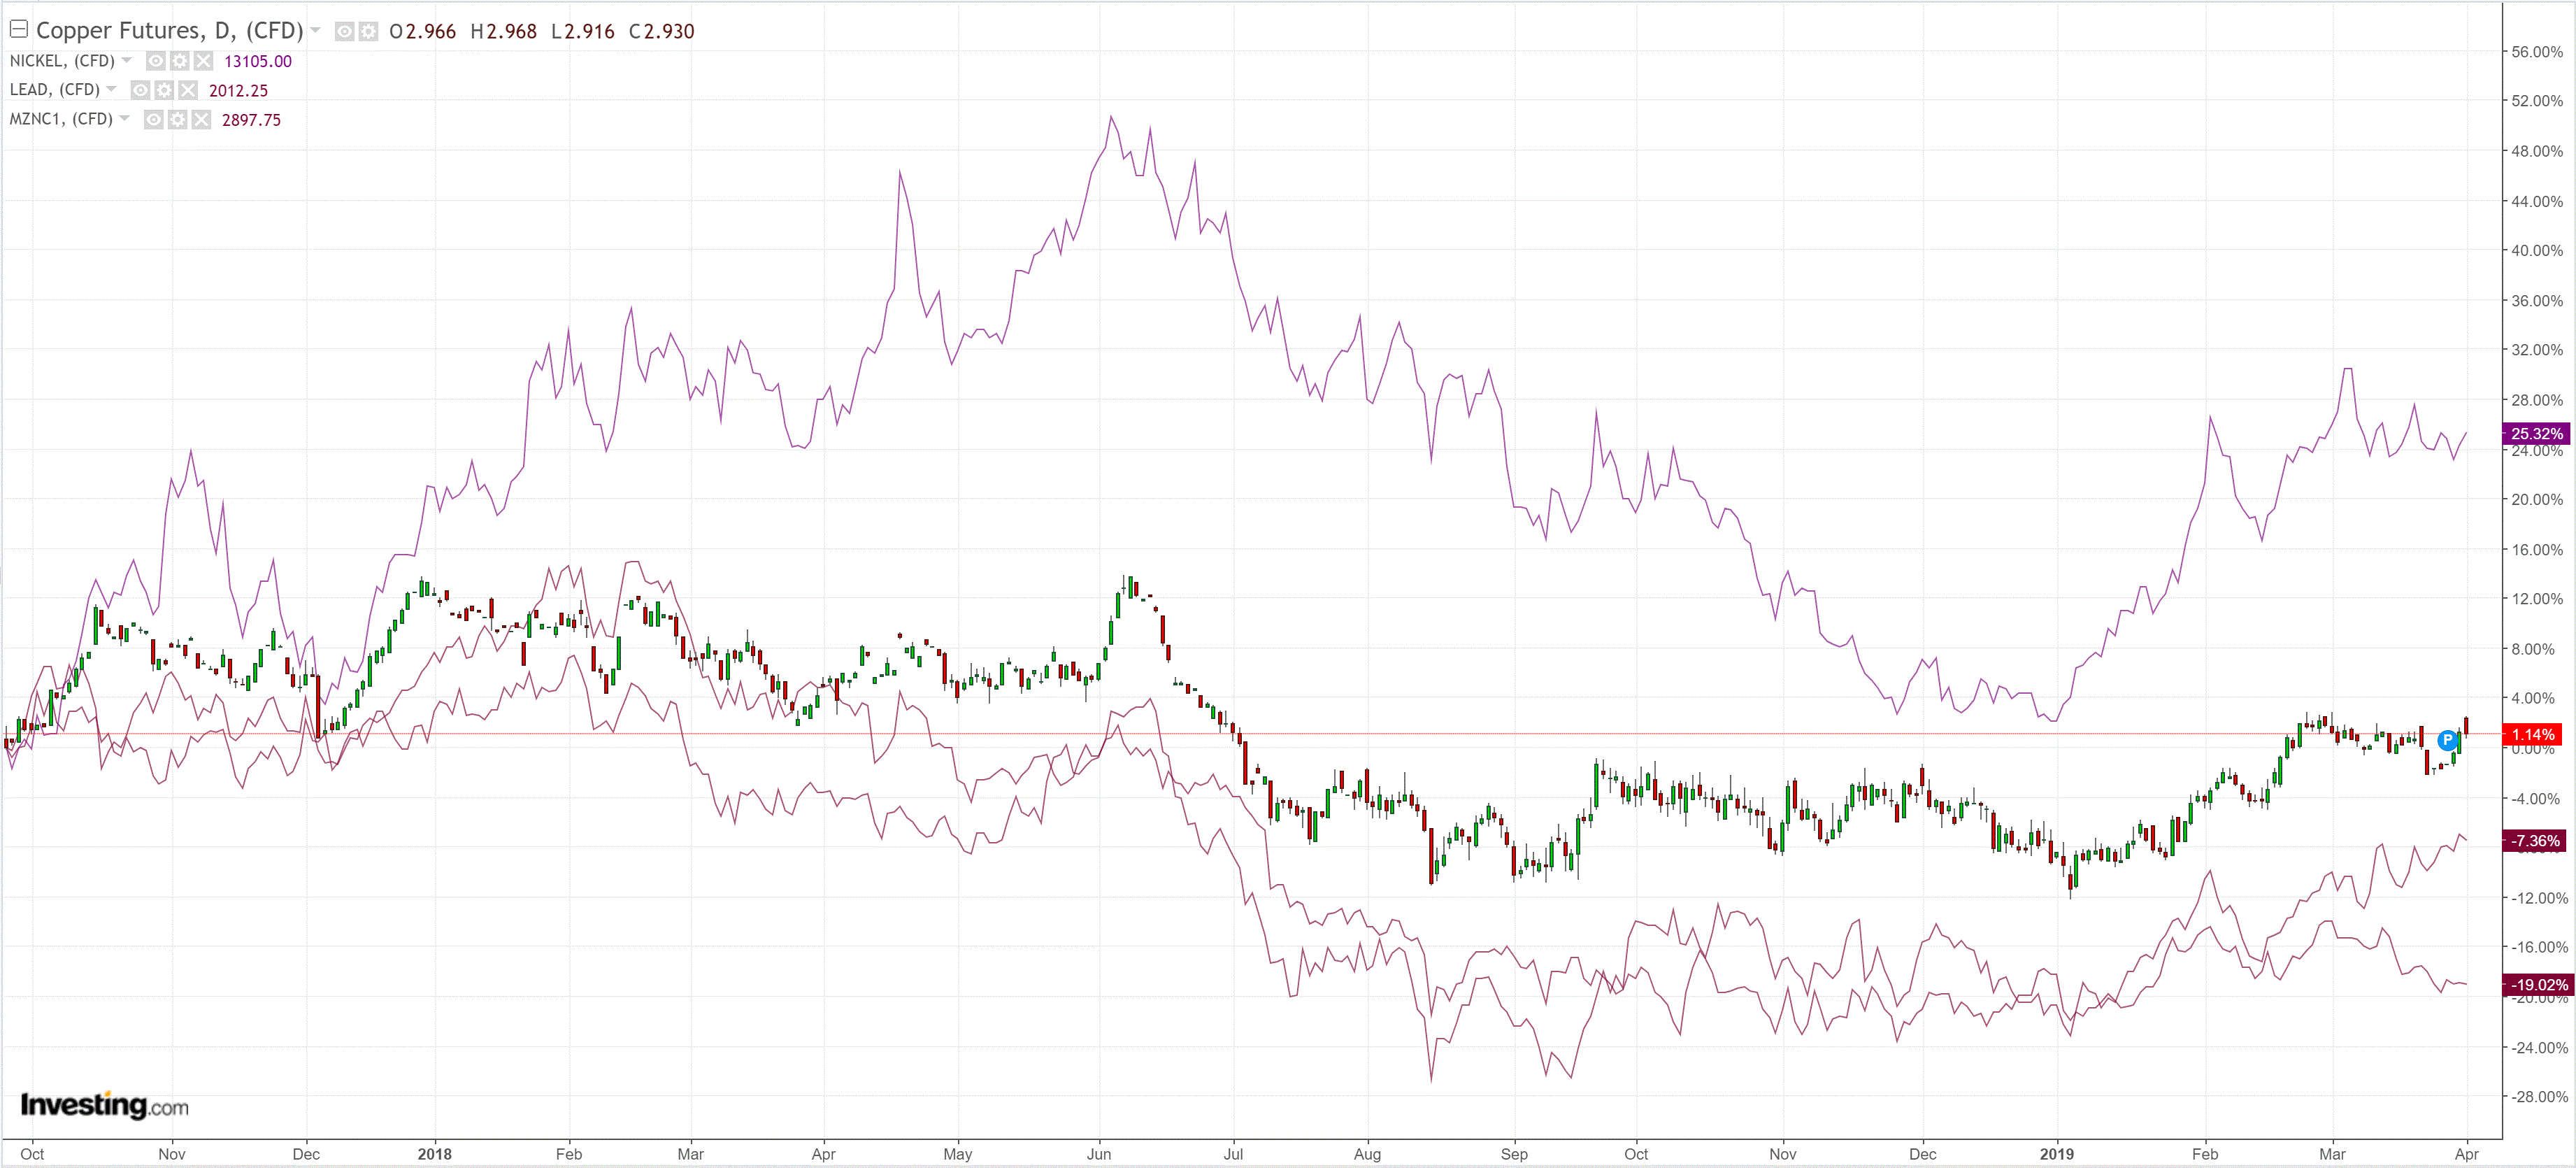
Metals were mixed:
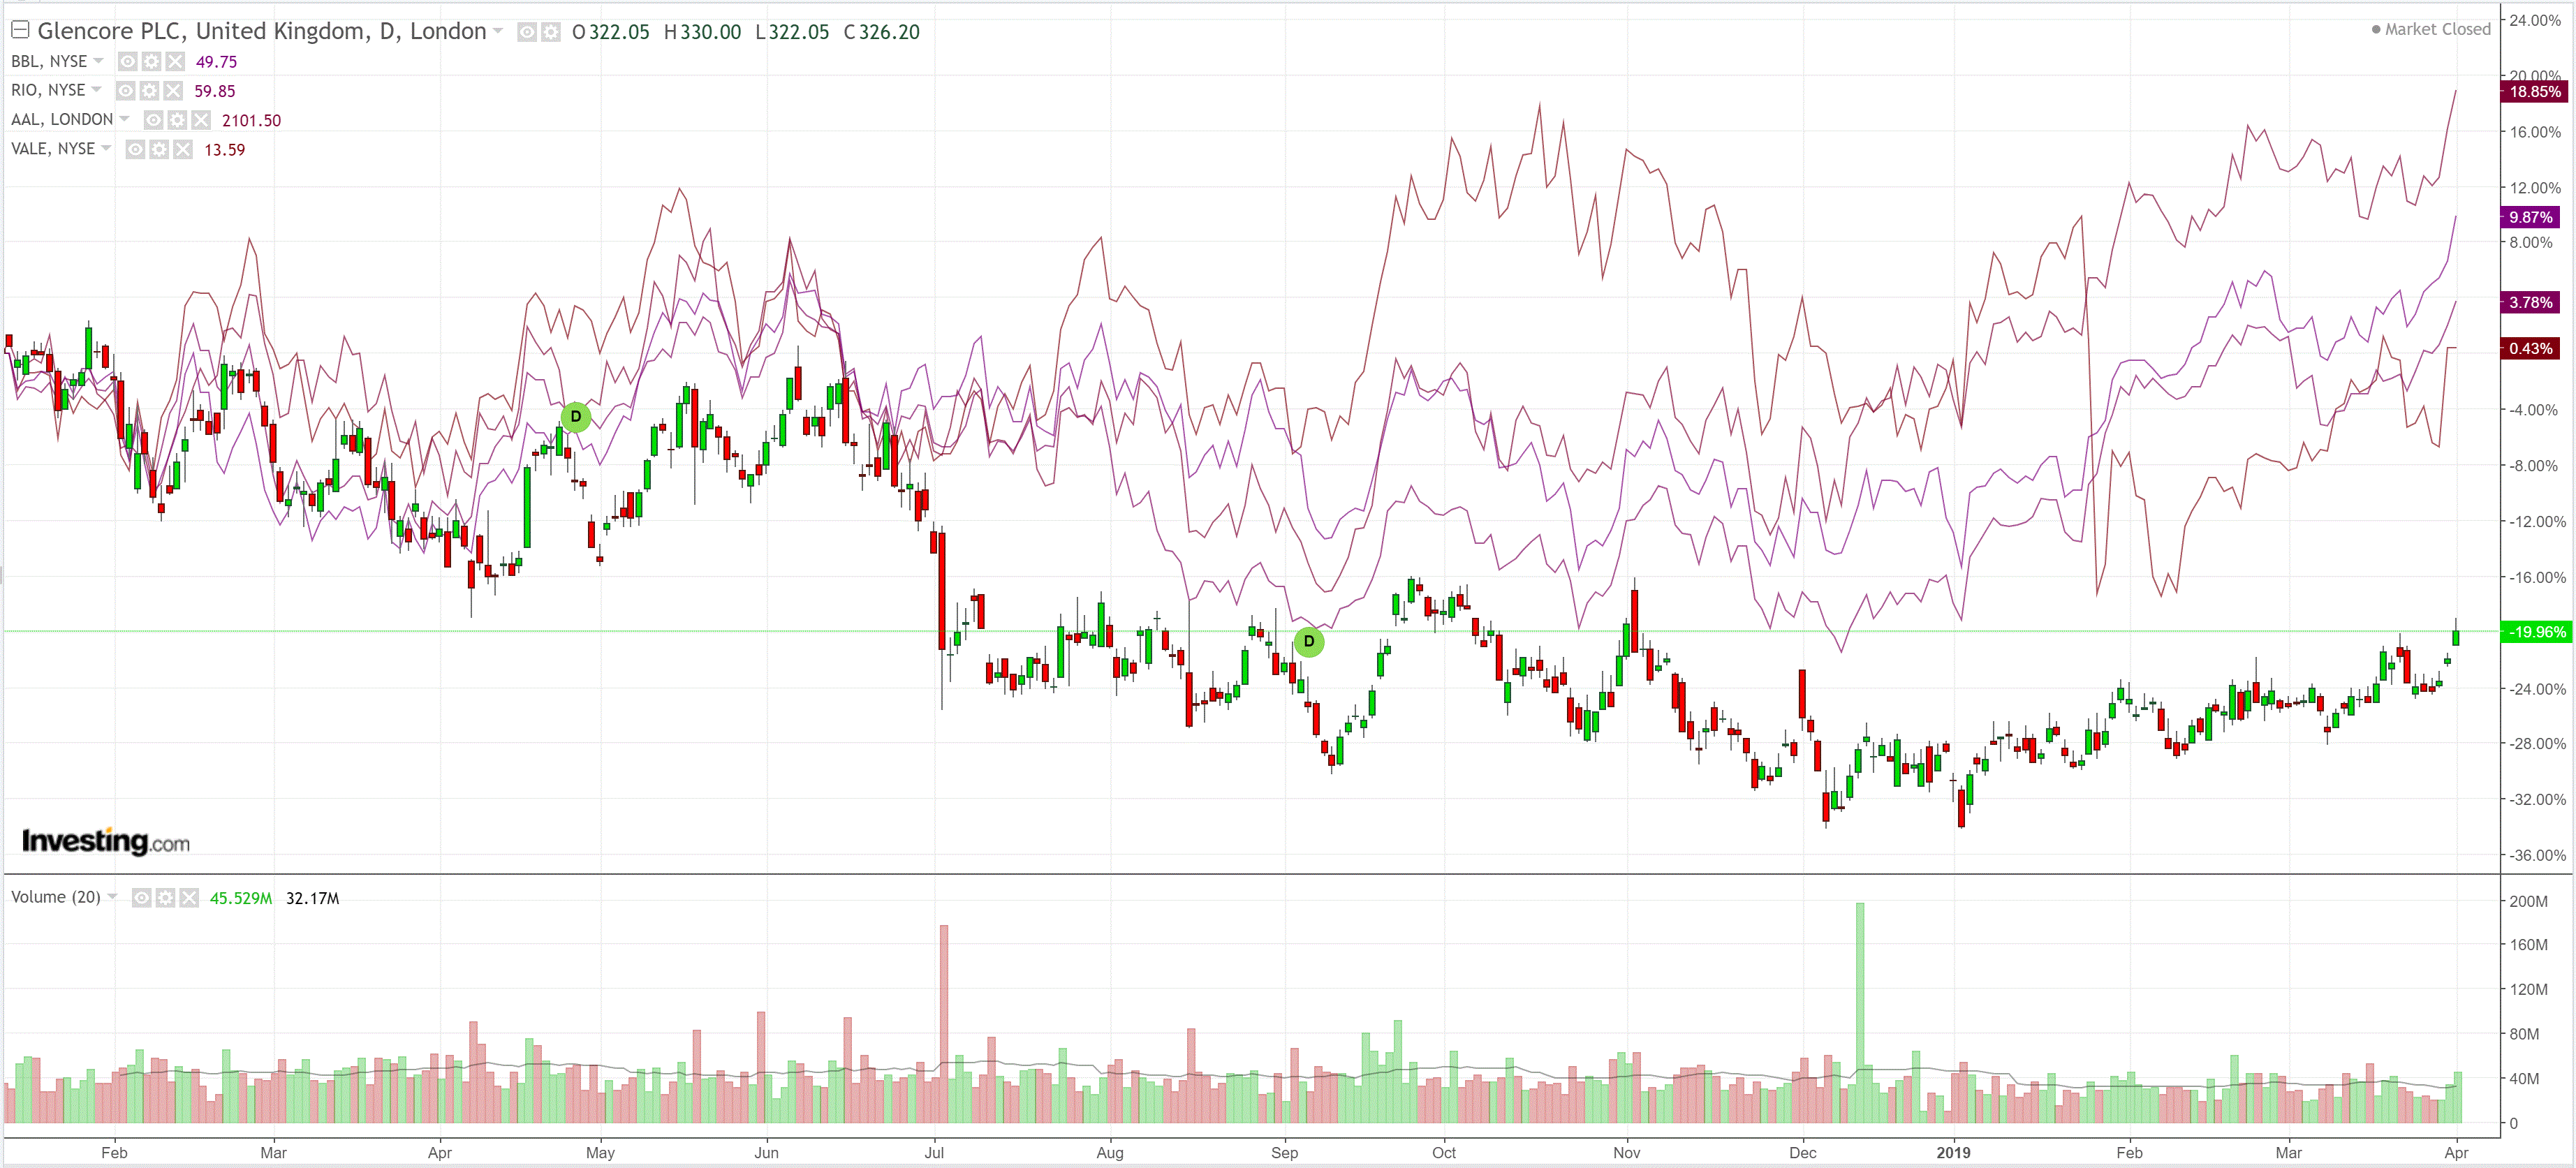
Miners went nuts:
Advertisement
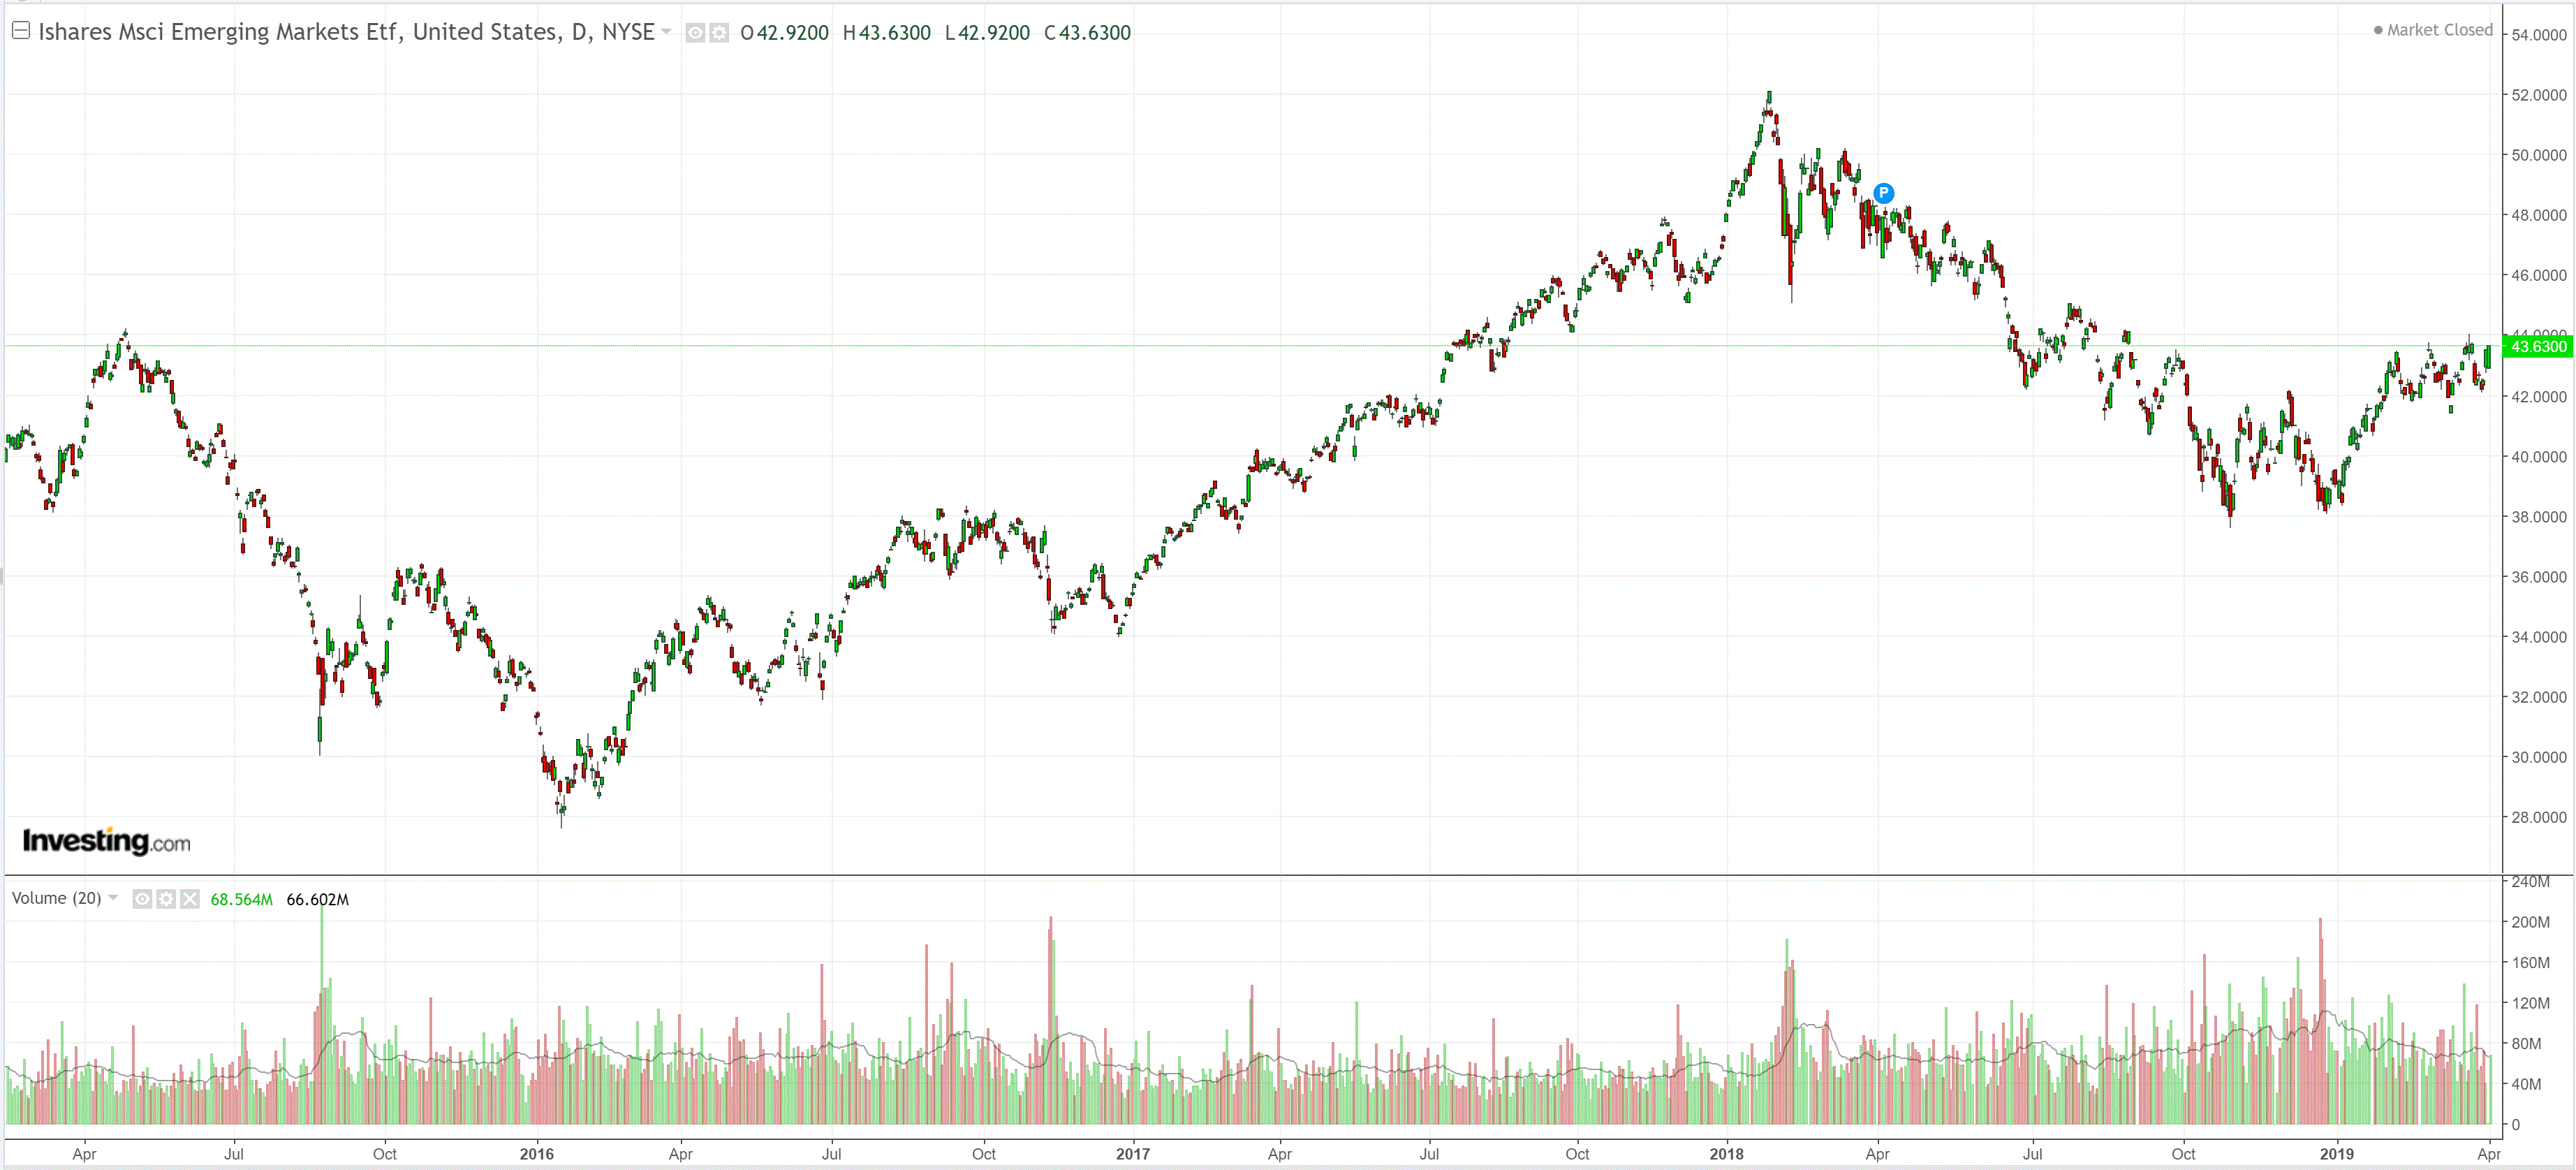
EM stocks jumped:
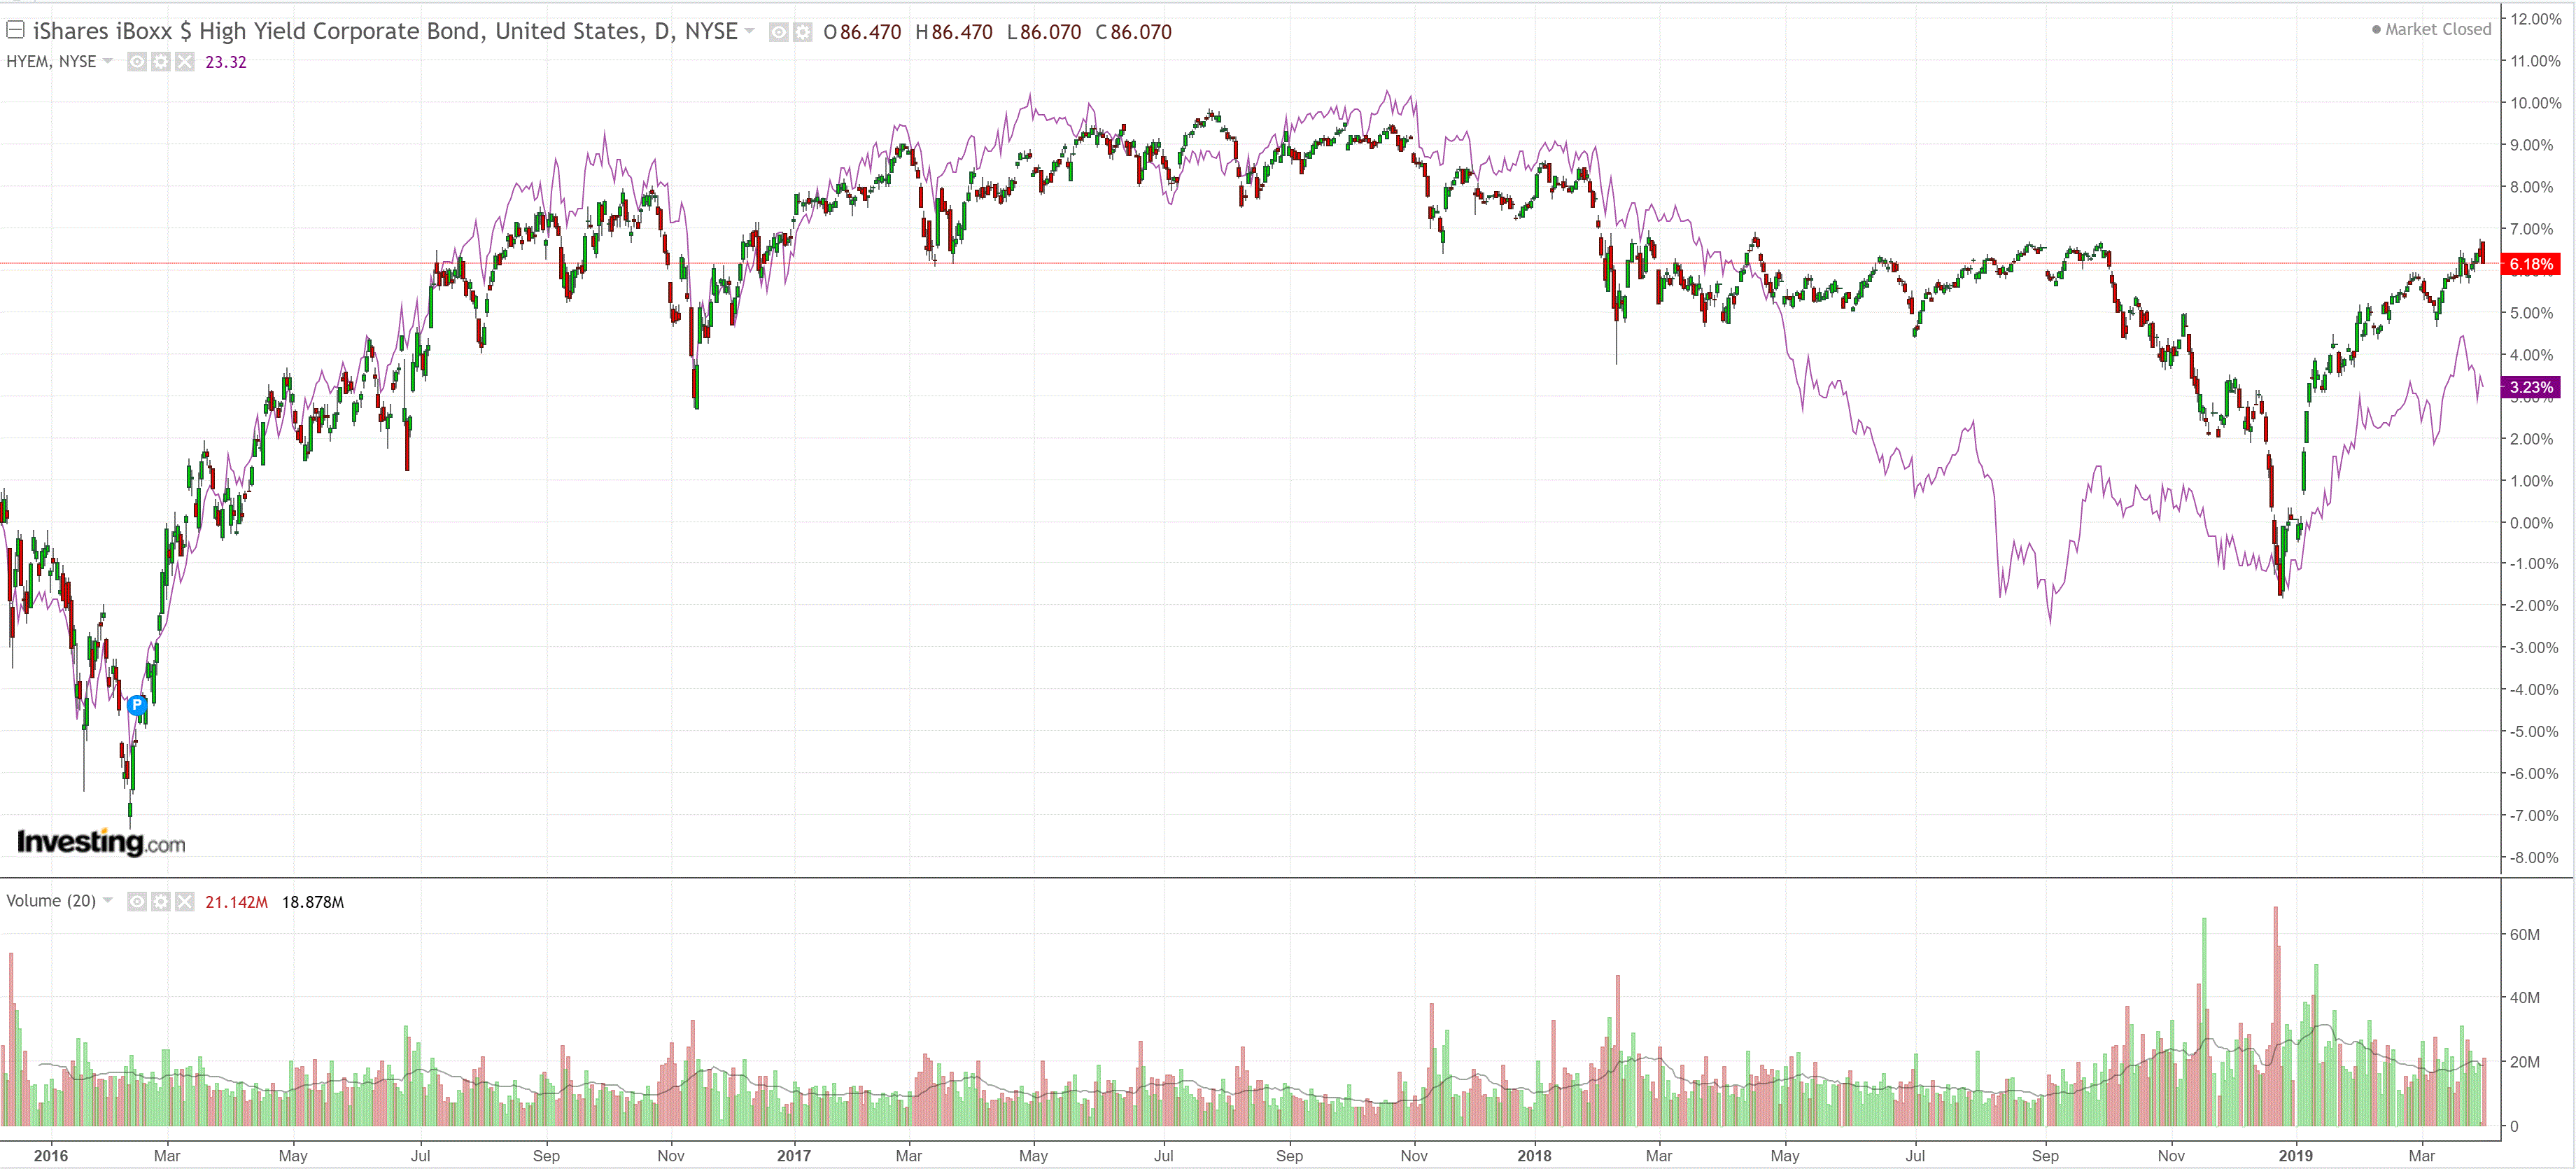
Junk was hit:
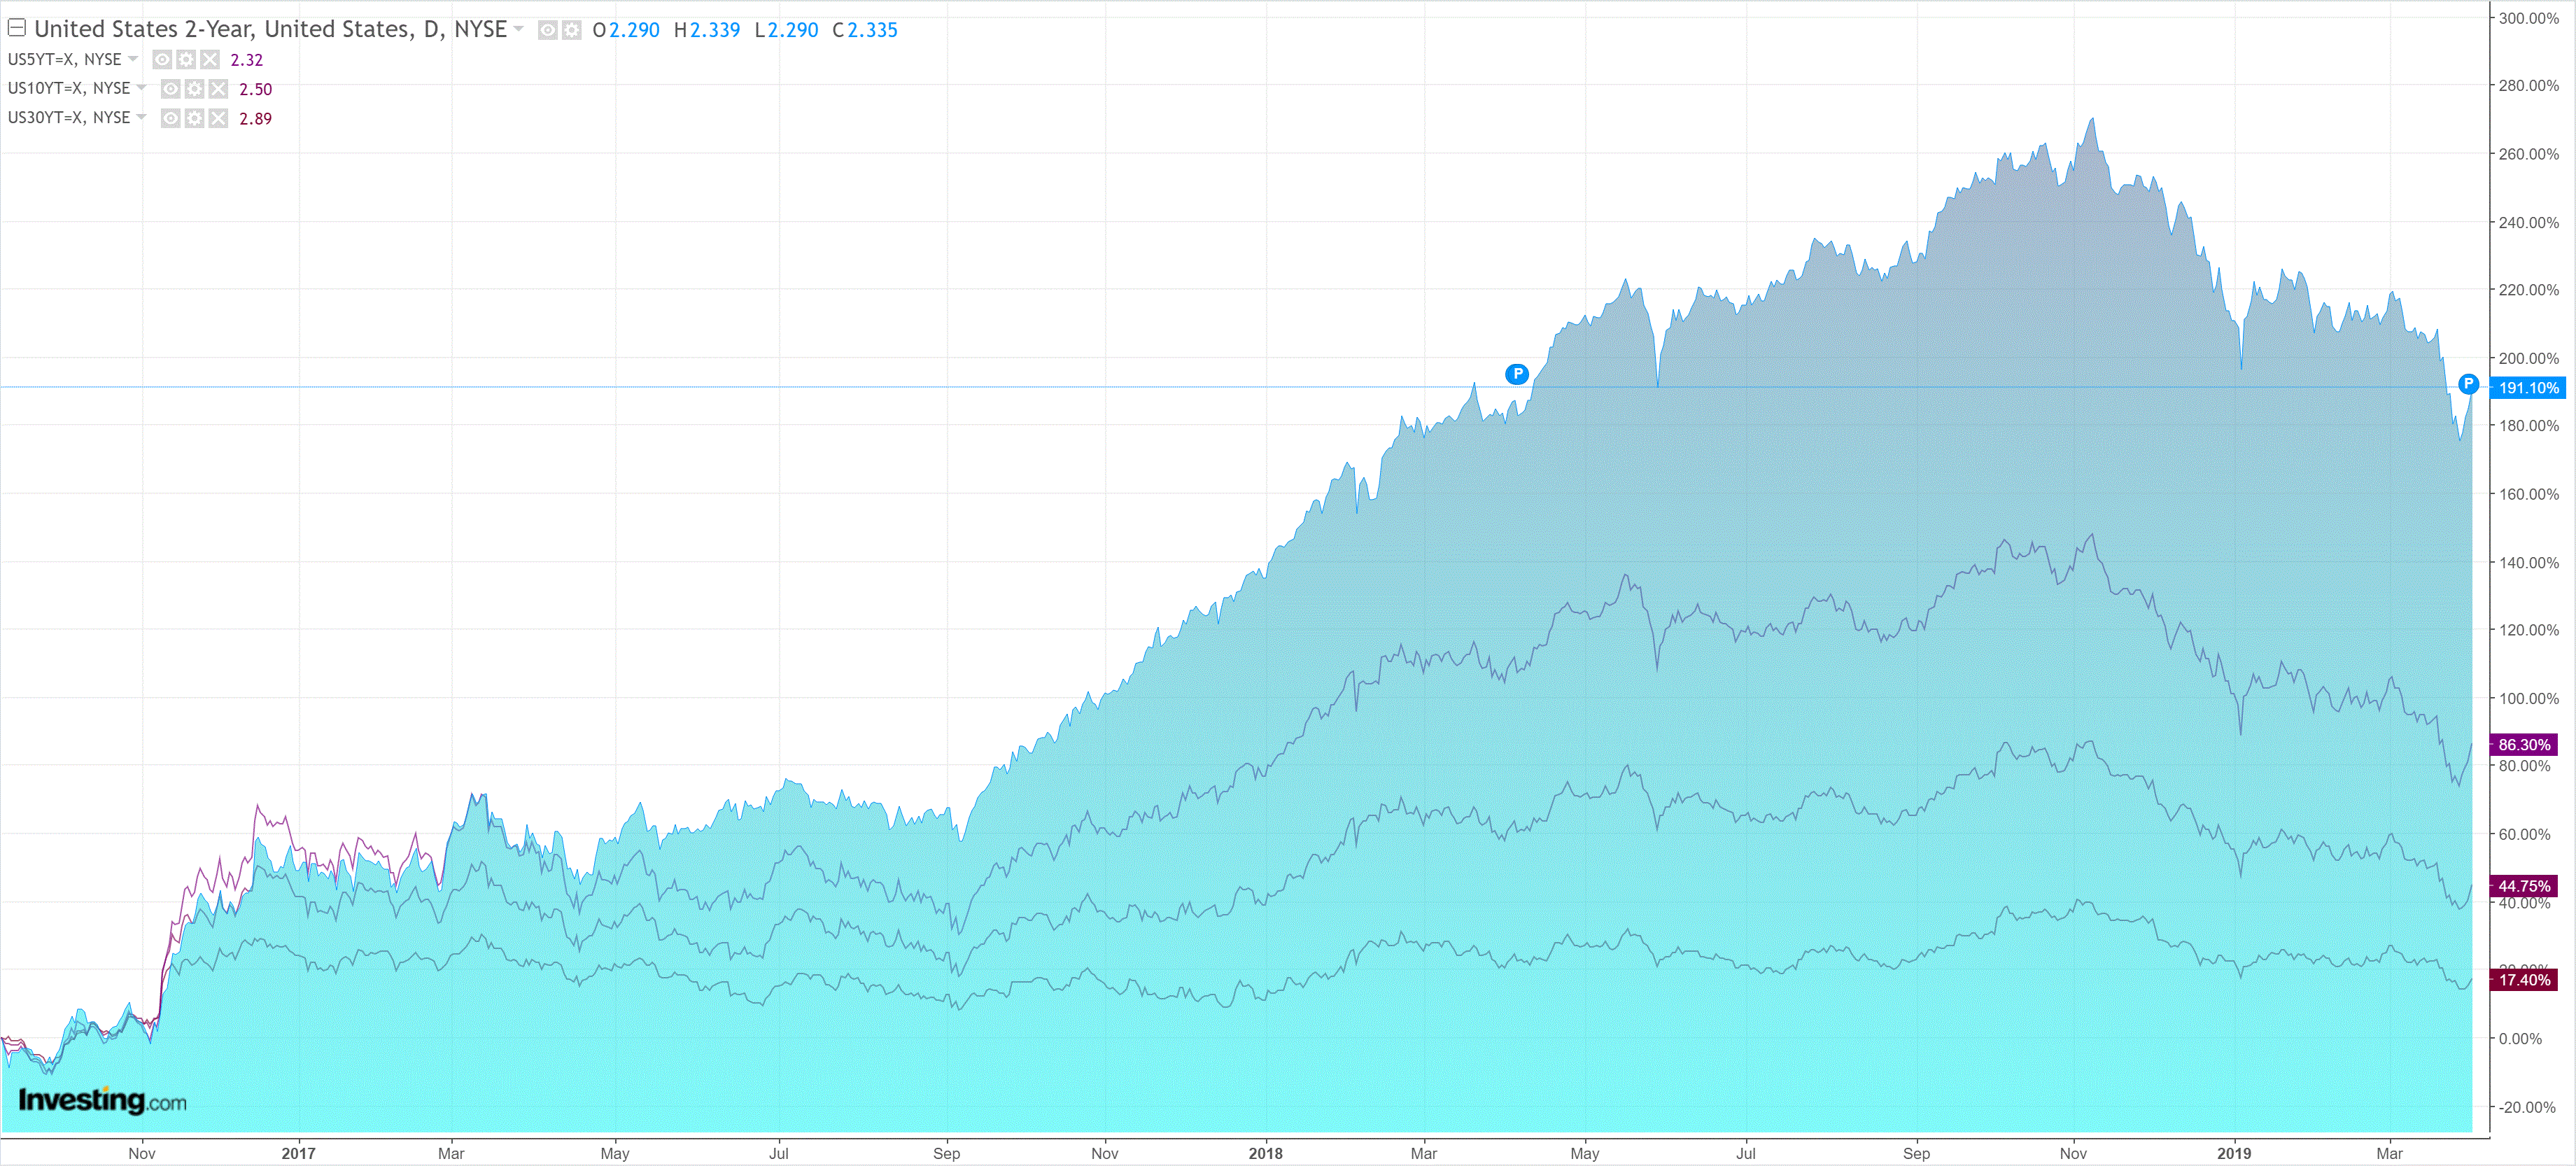
As Treasuries got thrashed:
Advertisement
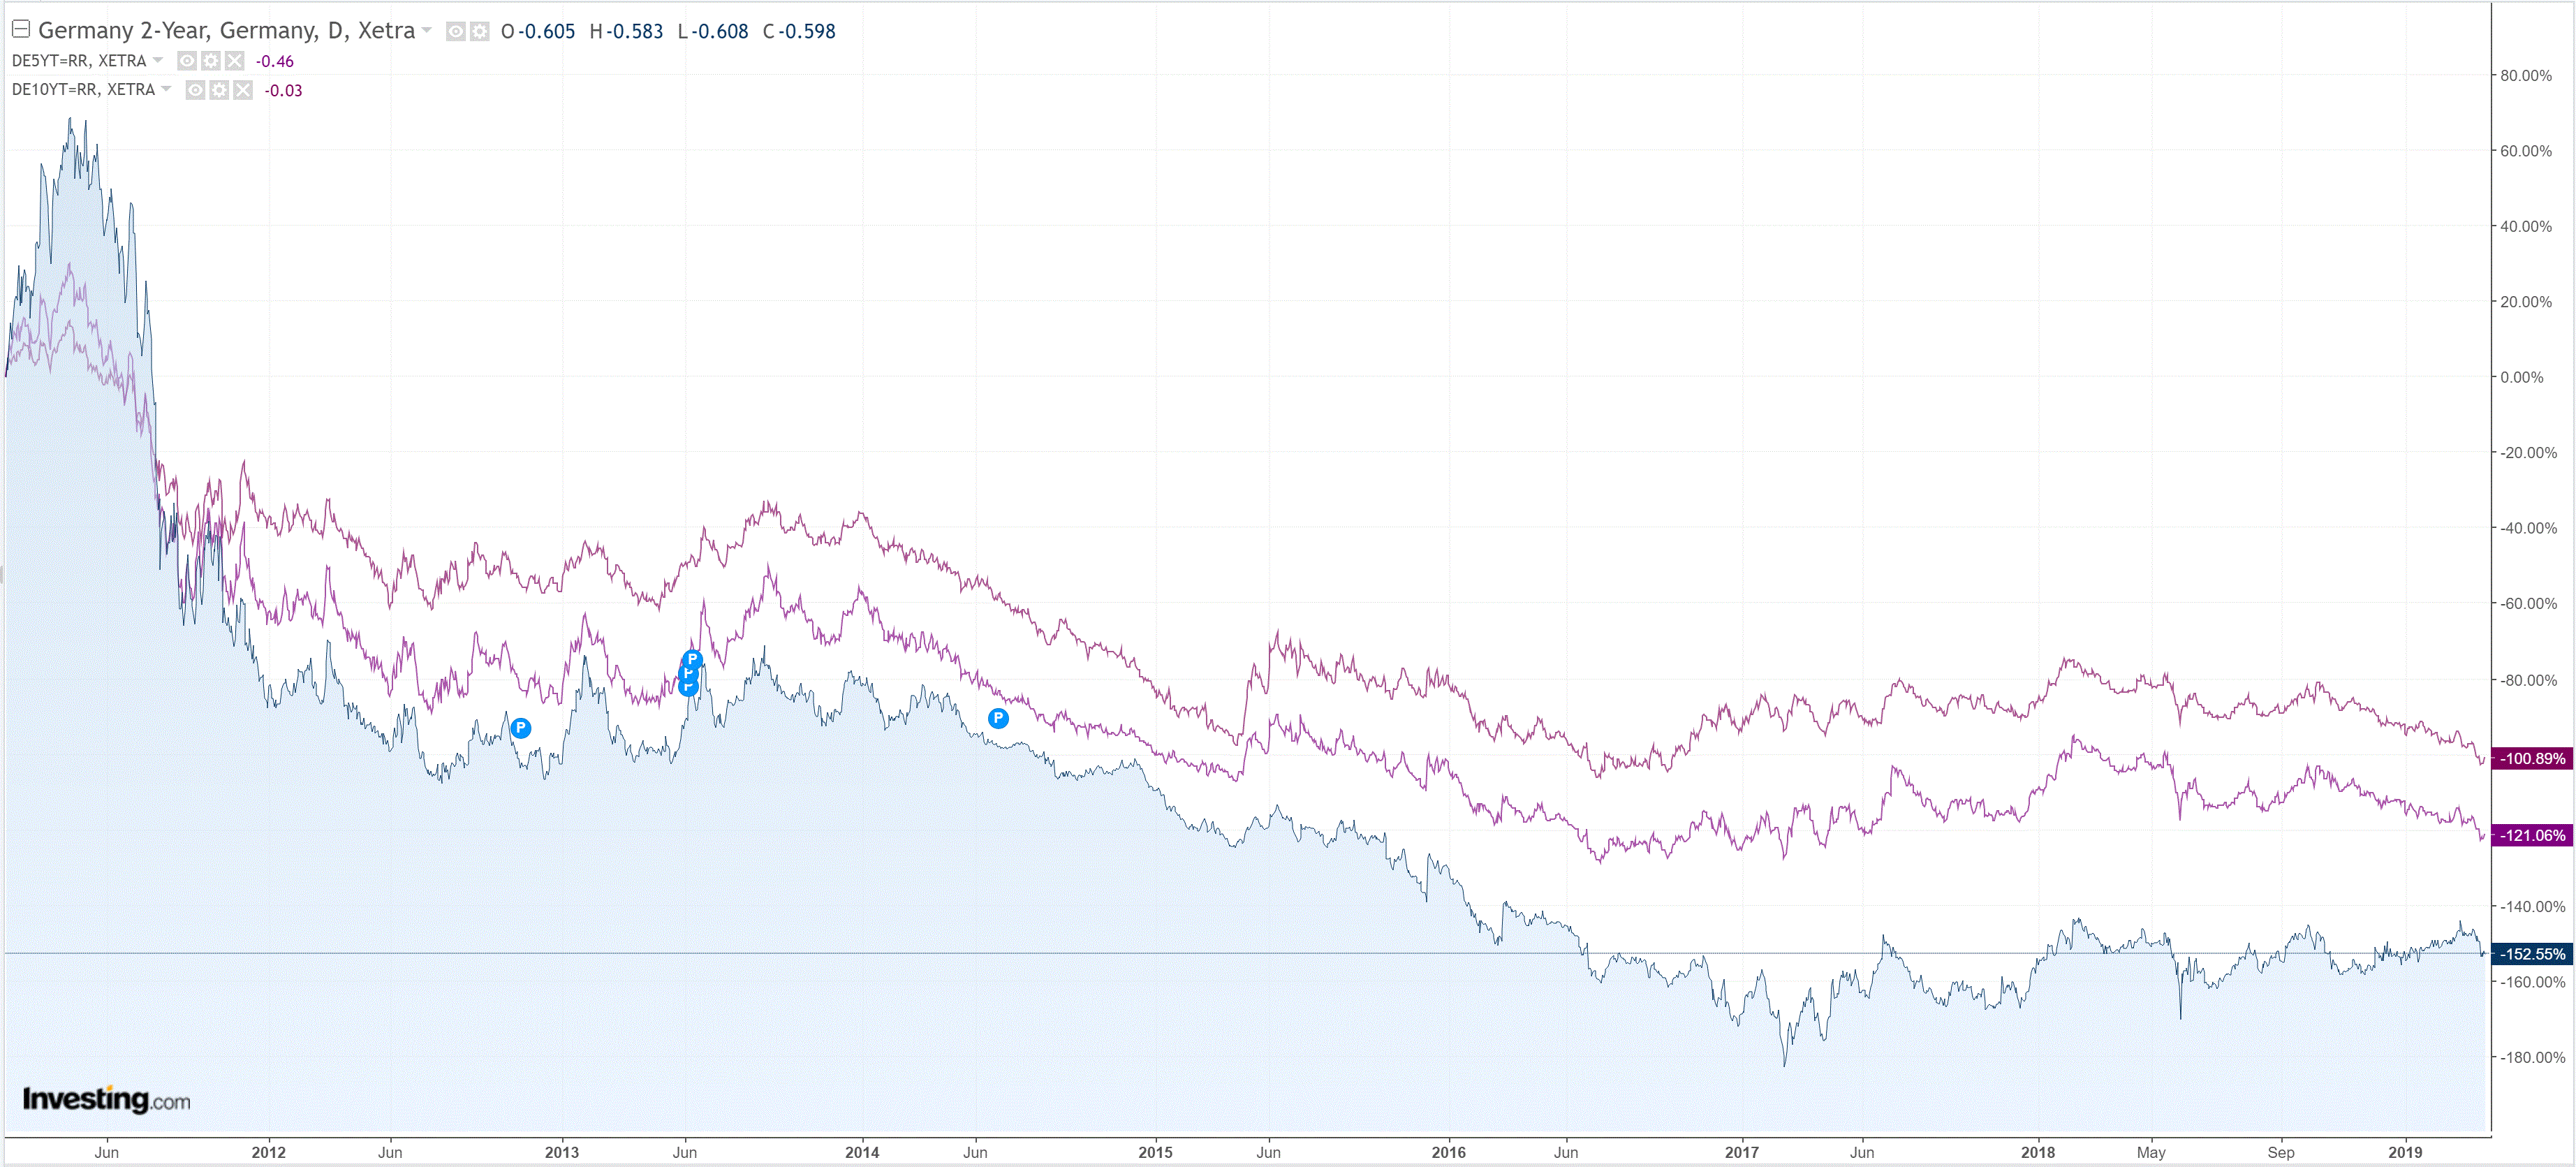
Bunds less:
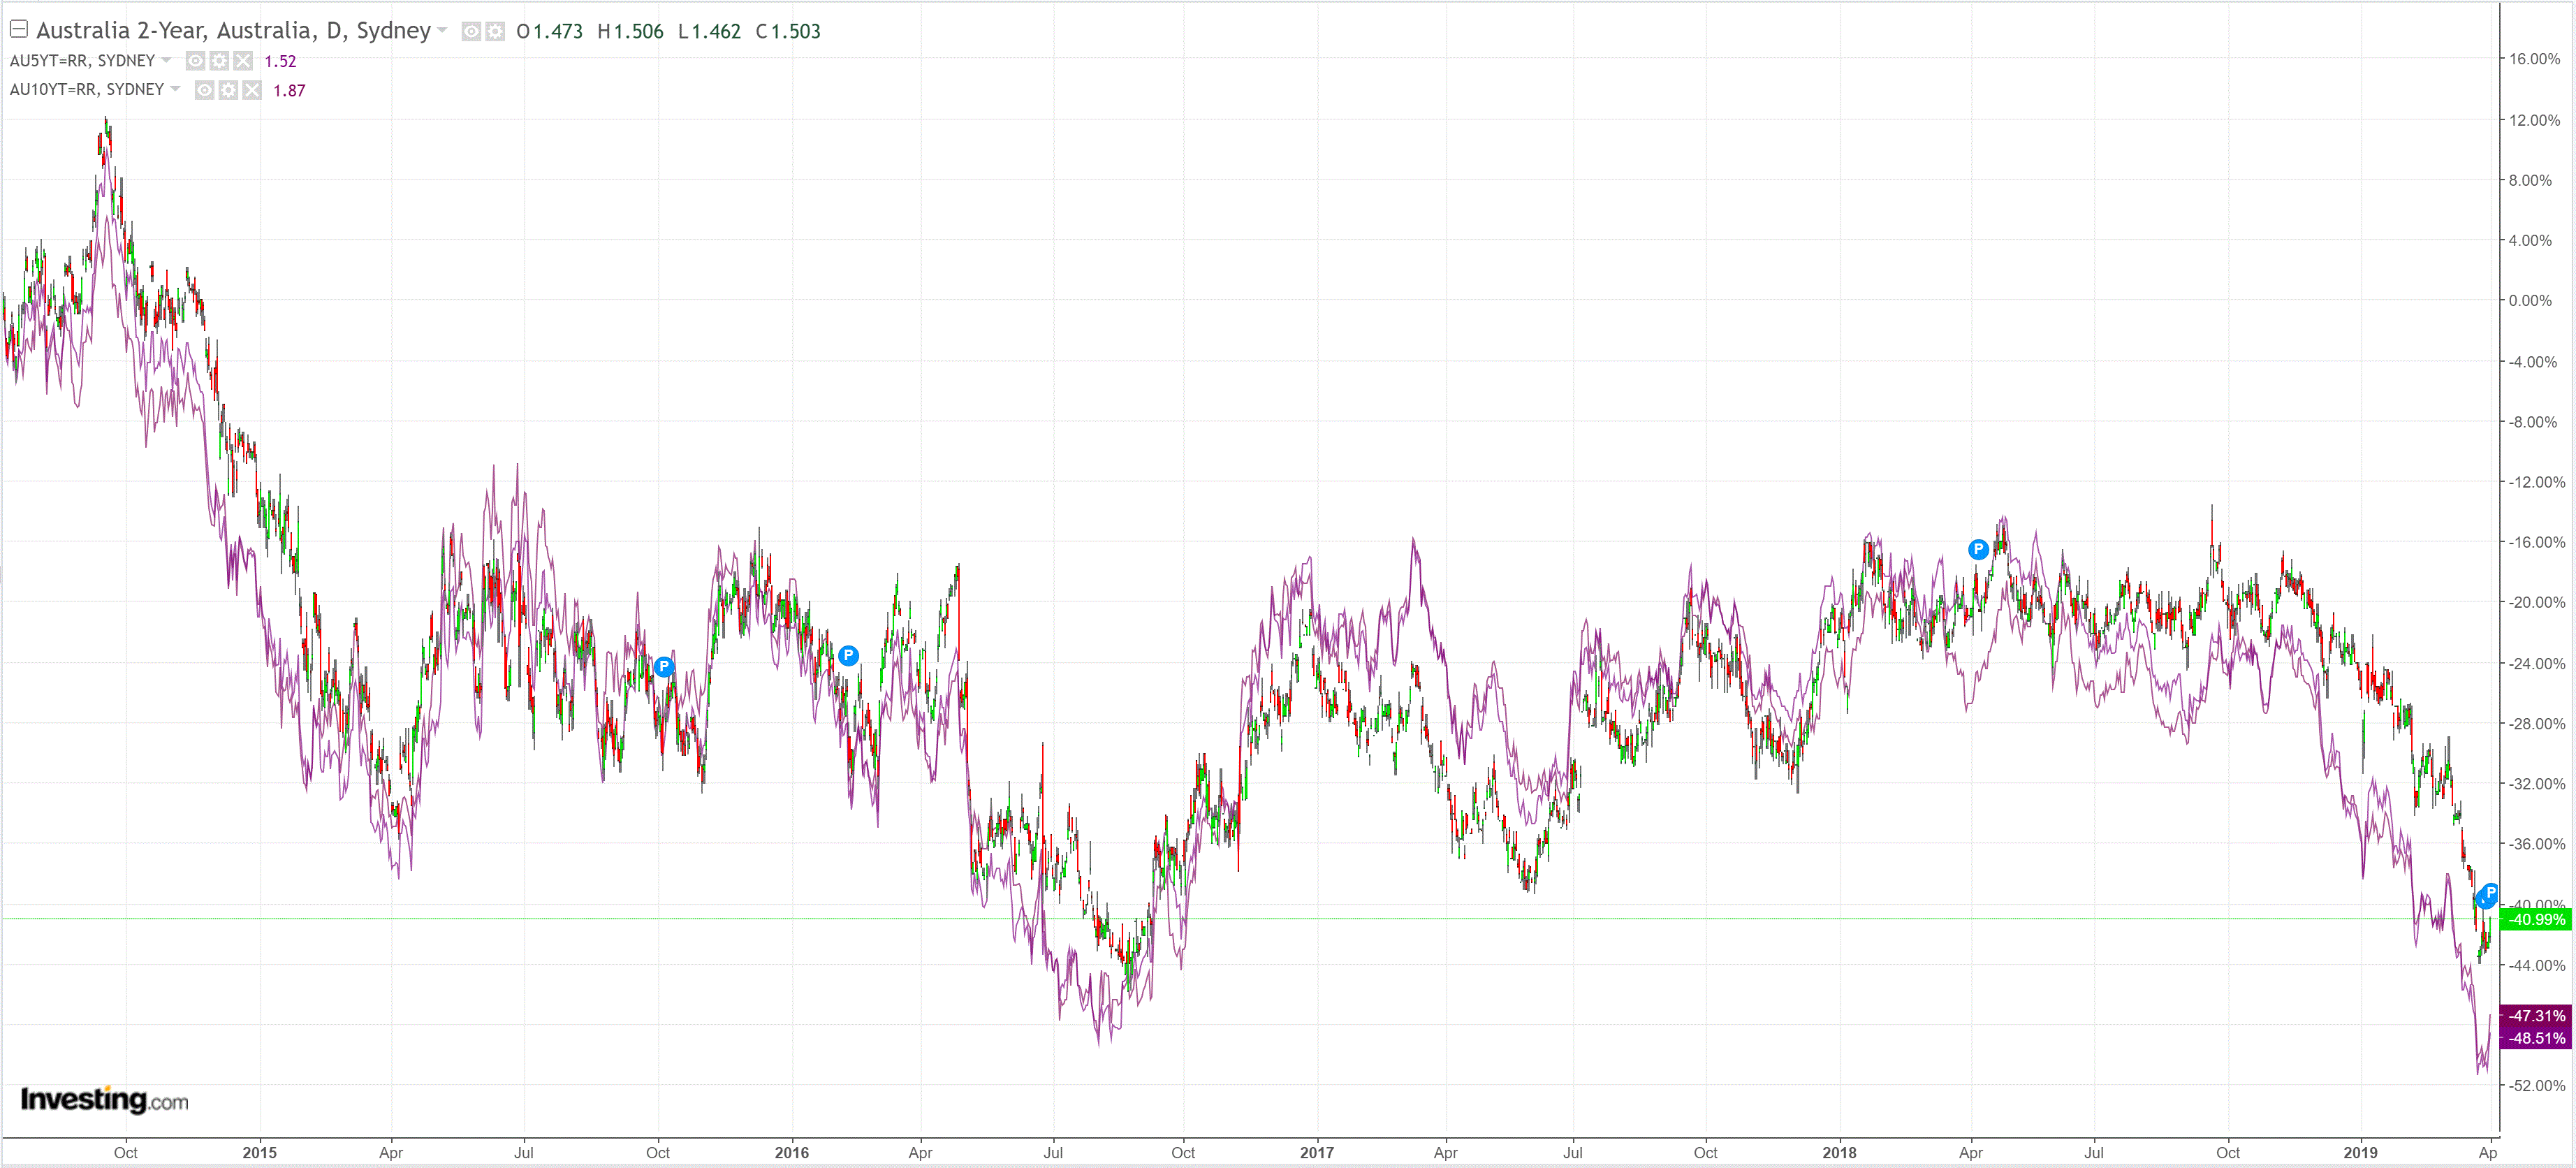
Aussie bonds were whip-lashed:
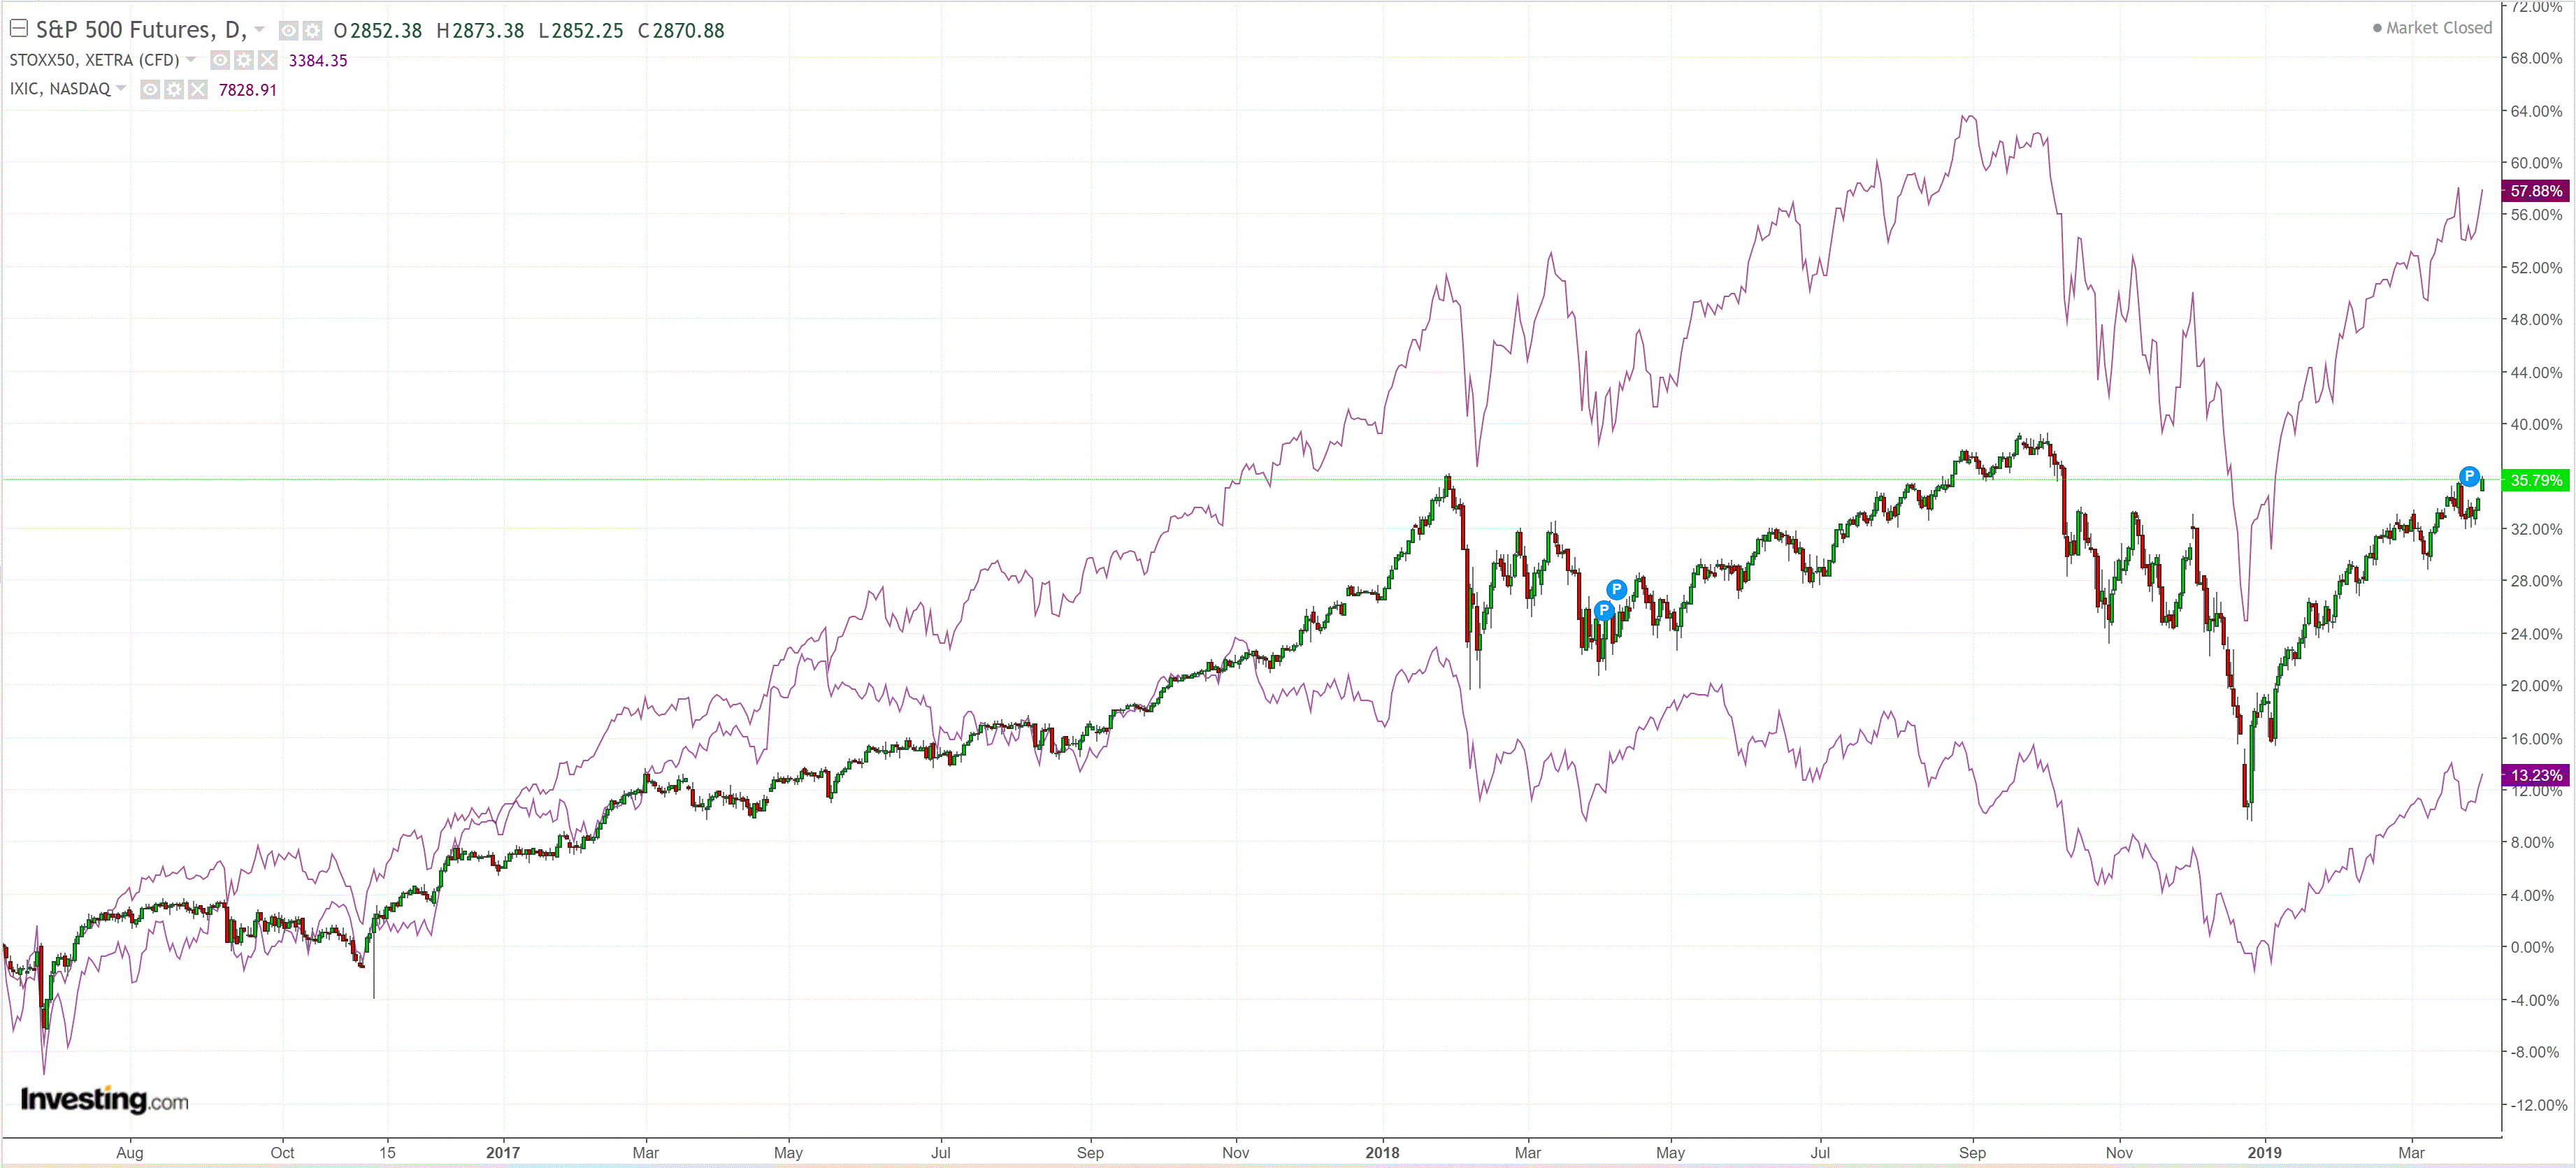
And stocks took off:
Advertisement
Westpac has the wrap:
Event Wrap
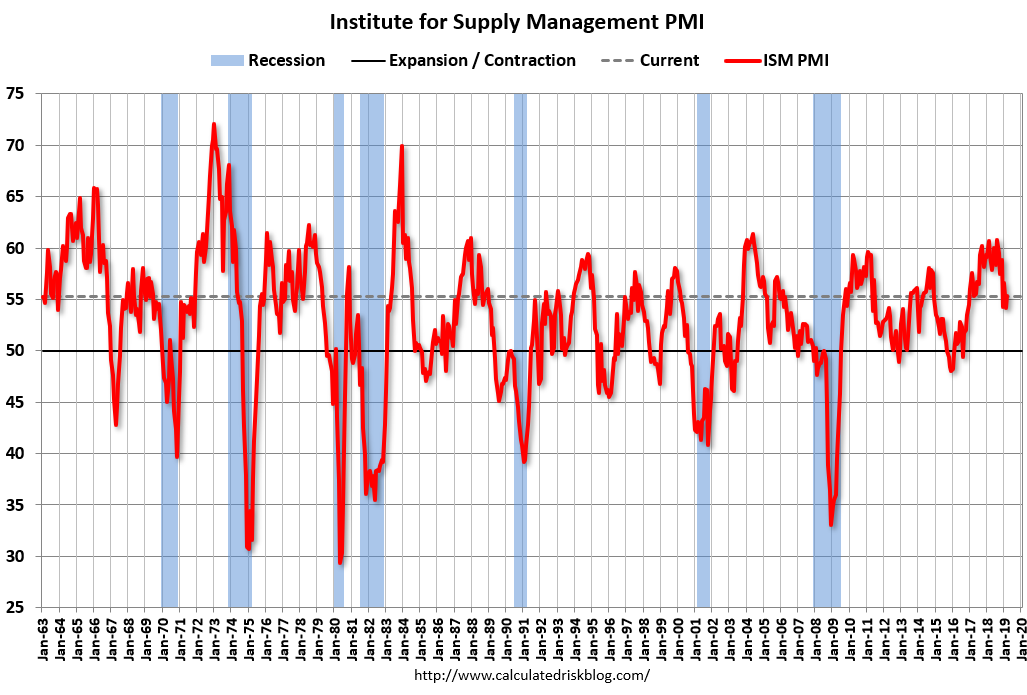
The rise in US ISM manufacturing was comforting – up from 54.2 to 55.3 – led by stronger new orders (+1.9pts to 57.4) and a sharp recovery in employment (+5.2pts to 57.5). Meanwhile, construction spending will lead to a meaningful lift in GDP tracking estimates, with a solid 1% gain in Feb and Jan is now seen at 2.5% from an initial estimate of 1.3%.
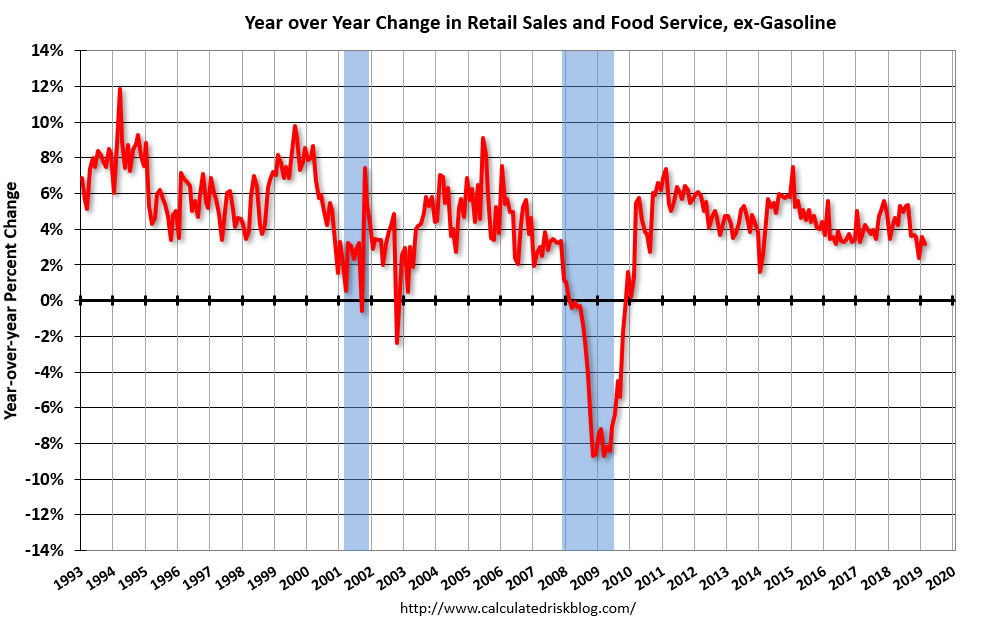
Feb retail sales was underwhelming – both the headline and the core control group fell 0.2%, a material miss for both, though upward revisions to the prior month are demonstrably stronger; the headline revised up to 0.7% from 0.2%, while the core control group was revised up to 1.7% from 1.2%. There may be an “inclement weather” effect with building materials down a huge 4.4% in the month.
Final March Eurozone manufacturing PMI slipped to 47.5 from its flash reading of 47.6 but notably Germany’s PMI was marked down to 44.1 (from 44.7) – its lowest level in 80 months. The three largest Eurozone countries (Germany, Italy and France) were all in sub-50 contraction and forward components such as export and new orders were lower and prices were now under downward pressure all indicating weakness for 2Q.
Event Outlook
NZ: NZIER quarterly business confidence survey will be closely watched since it’s one of the few major releases ahead off the RBNZ MPS in May, and is a decent indicator of near-term GDP growth.
Australia: Feb dwelling approvals are expected to decline by 1.8% (Westpac fcs -1.0%). The Apr RBA policy decision is expected to be on hold and Westpac is expecting the Governor’s statement to be fairly low key ahead of the Federal Budget at 7:30 pm. The Federal Budget is anticipated to forecast a 2019/20 underlying cash balance of +$4.6bn compared to the $4.1bn forecast at MYEFO. Westpac sees an unchanged $4.1bn forecast with the upside surprise to revenue from stronger nominal GDP growth (higher commodity prices) expected to be returned to the people through tax cuts and increased spending.
US: Feb (preliminary) durable goods orders are expected to decline 1.8% following a 0.3% gain in Jan. Core capital goods orders are seen to edge up 0.1% after a 0.8% lift in Jan.
“The March PMI® registered 55.3 percent, an increase of 1.1 percentage points from the February reading of 54.2 percent. The New Orders Index registered 57.4 percent, an increase of 1.9 percentage points from the February reading of 55.5 percent. The Production Index registered 55.8 percent, a 1-percentage point increase compared to the February reading of 54.8 percent. The Employment Index registered 57.5 percent, an increase of 5.2 percentage points from the February reading of 52.3 percent. The Supplier Deliveries Index registered 54.2 percent, a 0.7 percentage point decrease from the February reading of 54.9 percent. The Inventories Index registered 51.8 percent, a decrease of 1.6 percentage points from the February reading of 53.4 percent. The Prices Index registered 54.3 percent, a 4.9-percentage point increase from the February reading of 49.4 percent, indicating a return of increasing raw materials prices after a two-month respite.
Advertisement
Retail was OK ex-oil:
Advance estimates of U.S. retail and food services sales for February 2019, adjusted for seasonal variation and holiday and trading-day differences, but not for price changes, were $506.0 billion, a decrease of 0.2 percent from the previous month, but 2.2 percent above February 2018. … The December 2018 to January 2019 percent change was revised from up 0.2 percent to up 0.7 percent.
Combined with the better Chinese data, the bond curve steepened and we got a whip-lash from fixed interest to equities. Probably the key on that front is that oil is suddenly building in a little inflation shock by year end as the growth tone improves:
Advertisement
But one day does not a summer make. Can it last? Capital Economics:
Unless you’ve locked yourself away in a dark room for the past week (and, for UK readers, that would be entirely understandable given the debacle over Brexit), then you’ll have heard plenty of discussion about how bond markets have become increasingly gloomy about the economic outlook. Specifically, yields on long-dated government bonds in the US have fallen below those of shorter-dated bonds – thus “inverting” the usually upward sloping yield curve. So what should we make of this?
It’s important to note from the outset that there is no mechanical pass-through from an inverted yield curve to weakness in the real economy. Instead, the significance of the yield curve stems from the fact that it reflects the collective wisdom of deep and liquid bond markets. When long yields drop below short yields it’s because the markets are anticipating that central banks will need to loosen policy in the future to support a slowing economy. The yield curve has inverted ahead of every recession in the US over the past 50 years, with only one false positive (in 1998). It’s therefore about as good a recession indicator as we’re going to get.
The big development over the past week or so is that yields on 10 year US government bonds have fallen below 3-month US Treasury bill rates. The more closely watched 10-2 year spread is still (just about) positive. But that doesn’t offer much reassurance since, at just 15bps, it is also now perilously close to inverting.
Admittedly, the yield curve may have been distorted by structural changes affecting the bond market in recent years. For example, regulatory changes have encouraged banks to hold more longer-dated government securities and central banks look set to maintain larger balance sheets than in the past. Both factors are likely to have pushed down longer-dated yields, thus making the curve more prone to inversion.
What’s more, irrespective of any structural changes in the bond market, the yield curve has never been a particularly good predictor of when a recession might occur. The 10-2 year yield has inverted anywhere between 9 and 23 months ahead of the past five recessions in the US. In other words, if the curve were to invert tomorrow, we might be looking at a US recession at any point between the end of this year and the middle of 2021.
But all of this risks missing the wood for the trees. Yes, the 10-2 year part of the yield curve hasn’t yet inverted and, yes, it’s true that the curve may be more prone to inversion now than in it has been in the past. But obsessing about whether or not the 10-2 year part of the curve will invert misses the bigger point that the whole curve has already flattened substantially – and that this has typically been a reliable indicator of cyclical economic downturns (if not recessions).
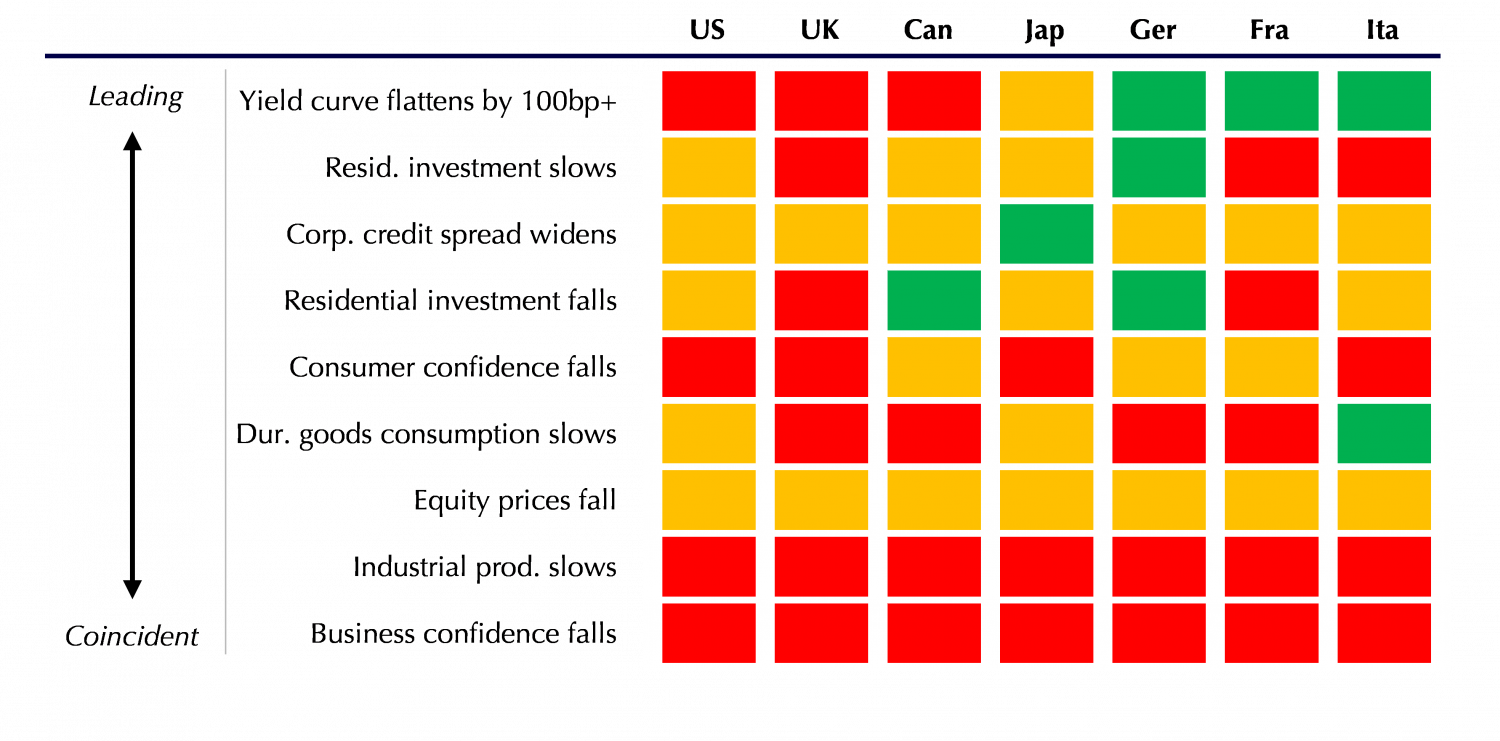
Moreover, while it’s true that the yield curve doesn’t have much to say about the timing of any future downturn, this feels like an odd argument to make when the economic data are deteriorating at an alarming pace. A few months ago I remarked that we had looked at the past 30 cyclical downturns in the G7 and identified key indicators that had signalled shifts in the cycle. What’s striking is just how many of these are now flashing amber or red, both in the US but also the rest of the developed world. (See Chart.) Against this backdrop, it would be a brave investor that downplays warning signs from the bond market.
Chart: Heat Map of Turning Points in Key Indicators around Cyclical Peaks (latest data)
My own view is that the Chinese signal is premature and therefore so is the European. On the US I was never as bearish as the market. Therefore not a lot has changed for me at this juncture notwithstanding a risk that the equity rally actually creates a more bullish outcome all by itself.
Advertisement
For the local bond market and AUD the key is still deteriorating domestic demand so I still see these moves as pullbacks within larger trends.
David Llewellyn-Smith is Chief Strategist at the MB Fund and MB Super. David is the founding publisher and editor of MacroBusiness and was the founding publisher and global economy editor of The Diplomat, the Asia Pacific’s leading geo-politics and economics portal.
He is also a former gold trader and economic commentator at The Sydney Morning Herald, The Age, the ABC and Business Spectator. He is the co-author of The Great Crash of 2008 with Ross Garnaut and was the editor of the second Garnaut Climate Change Review.