
With Australia’s housing correction now dragging on for 17 months, and peak-to-trough declines totalling 8.6% at the capital city level, it’s an opportune time to compare this correction with prior episodes.
The below chart shows the various dwelling corrections over the past 30-plus years at the 8-city level, as measured by CoreLogic:
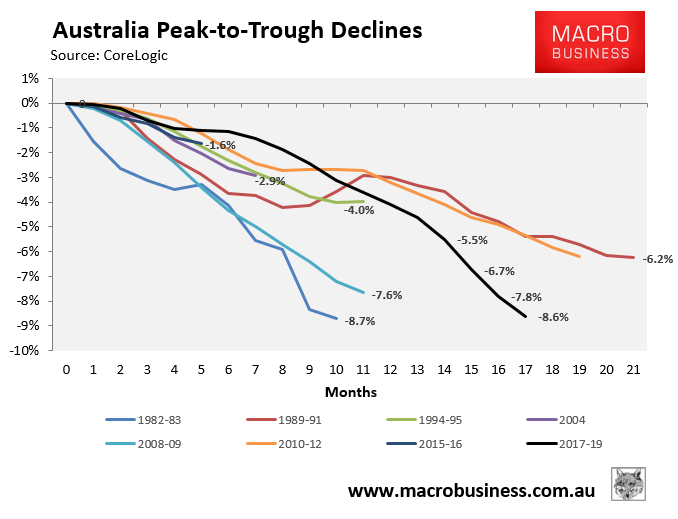
As you can see, this is the third longest running housing correction since the early 1980s, but the second biggest (8.6%) in terms of depth. The deepest correction to was 8.7% in 1982-83, which is about to be overtaken, whereas the longest was 21 months in 1989-91.
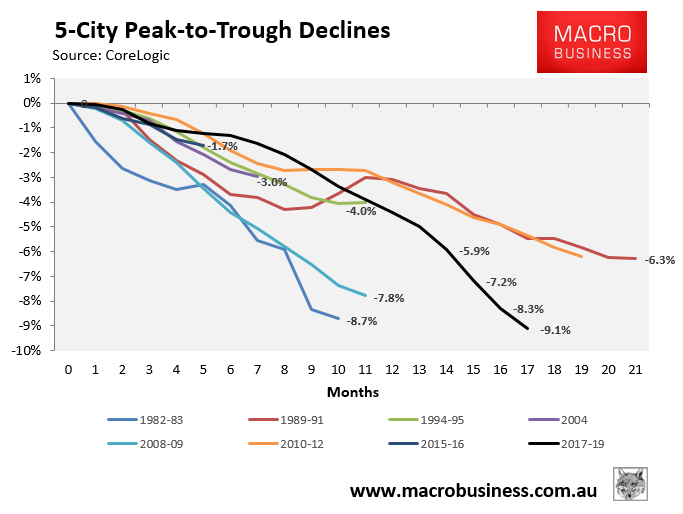
Across the five major capital cities, the current episode is already the deepest at 9.1% and the third longest running:
Next is Sydney, whose correction has been running for 19 consecutive months with cumulative losses of 13.2%. This is the second deepest correction versus prior episodes, as well as the third longest in terms of duration:
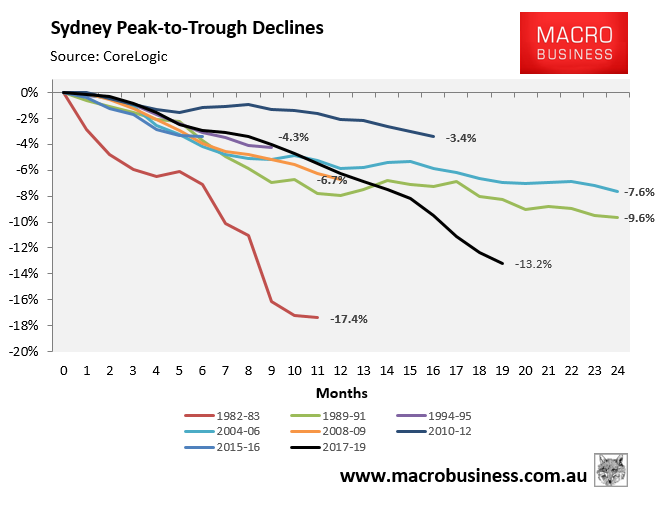
The deepest correct occurred in 1982-83 when values dived by 17.4%, whereas the longest correction was in 1989-91 and 2004-06 at 24 months.
Next is Melbourne, whose correction has been running for 15 consecutive months with cumulative losses of 9.6%. This is the second deepest thus far and the third longest in terms of duration:
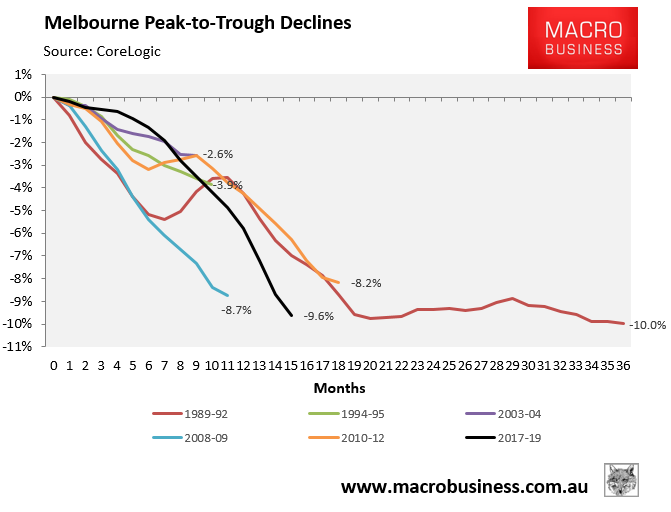
The deepest and longest correction was in 1989-92, which lasted 36 months and values fell 10%. This will almost certainly be overtaken soon.
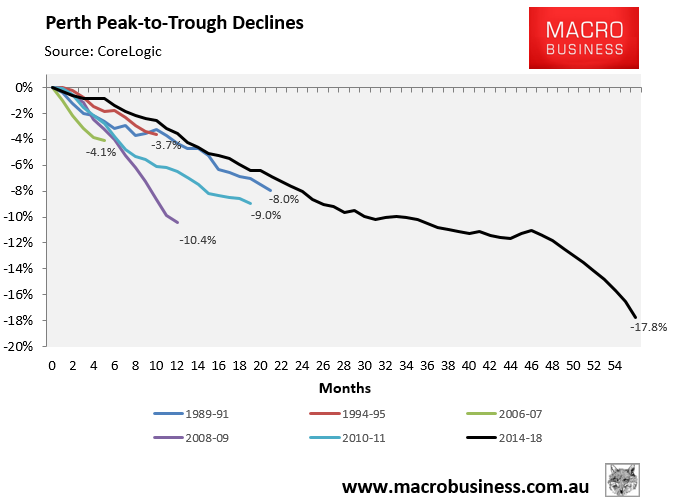
Finally we have Perth where values have fallen for well over four years with cumulative losses of 17.8%, blowing away prior corrections:
Finally, here’s how the current corrections across Sydney, Melbourne and Perth compare:
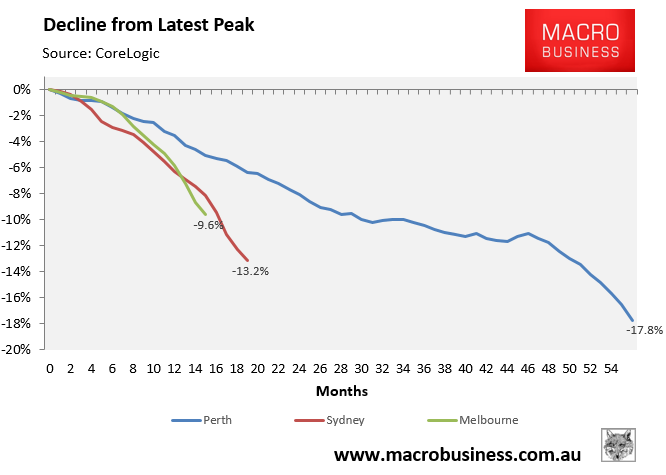
As you can see, the pace of losses has accelerated recently across each market.
What makes this property bust so unique is that it has occurred with official interest rates at all-time lows and unemployment falling. There are also stiff headwinds on the horizon, given:
- Ongoing tight credit availability following the banking royal commission’s final report;
- Ongoing out-of-cycle mortgage rate increases by the banks;
- The ongoing interest-only mortgage reset;
- The evaporation of Chinese demand;
- The crackdown and evaporation of demand from SMSFs; and
- Labor’s negative gearing and capital gains tax reforms.
Reading the tea leaves, this housing bust seems likely to run into 2020, by which time it will almost certainly be the biggest in modern Australian history.
