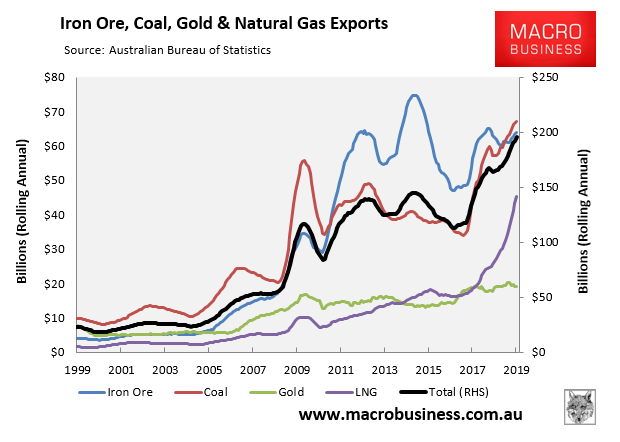
Examine this chart of Australia’s export performance from yesterday:
Coal and iron ore have delivered new export revenue booms. However, the most spectacular surge is the takeoff in LNG volumes, which is now mostly complete.
This is one reason why the Australian dollar is not as low as it should be. The commodities driven trade surplus has stabilised the current account deficit at its lowest levels in living memory:
Advertisement
Normally this would be a very good development, mitigating against the current housing bust turning into an outright financial crisis triggering capital flight.
But there is a problem. The coal and iron ore booms are barely touching the domestic economy but they do at least rebuild the budget via a huge corporate tax uplift. That will turn into stimulus down the road.
On the other hand, the LNG booms do not. Indeed the gas cartel pays no tax thanks to the giant rorts at the heart of their depreciating losses on plants that should never have been built.
Advertisement
When we add that the LNG business owners are also abusing their market power by applying discriminatory pricing across the east coast, the net effect on the economy is that the LNG shipments impose huge gas and power costs upon every household and business while also causing the AUD to remain higher than otherwise, smashing competitiveness.
Don’t take my word it. This was all modeled years ago by Victoria University which illustrated that the more LNG we ship at higher prices, the worse off we will be:
Introduction
What follows is an assessment of the economic impacts of two key developments in the gas market on the East Coast of Australia:
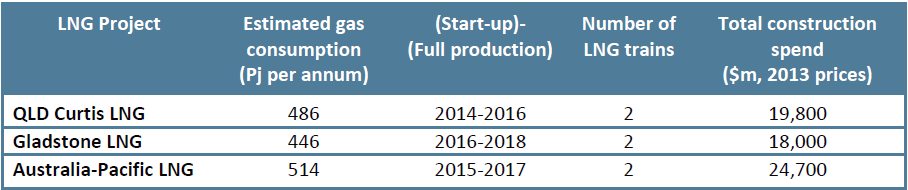
1. the construction and operation of three large LNG projects in QLD utilising gas generated, in part, from unconventional coal seam gas reserves in QLD; and
2. increases in the East Coast gas price to international parity for LNG.
Construction of the QLD Curtis project began in 2011 and is projected to be finished at the end of 2014. Construction of the other two plants has also commenced. It is assumed that the Australia-Pacific project will start up in 2015. It is assumed that the Gladstone LNG plant will start up in 2016.
It is assumed that when all of these projects are in full production, the gas price in the Eastern states (all states and territories other than WA and NT) will have risen to reflect linkages to international LNG prices. The current average price received by gas producers in the Eastern states is around $4.50 per Gj. The average price in 2011 was around $3.25 per Gj. It is estimated that the LNG-parity price in 2017 will be $11.00 per Gj.
The analysis is undertaken using the Victoria University Regional Model (VURM), which is based on the Monash Multi-Regional Forecasting model (MMRF). The impacts of the QLD LNG projects are computed using VURM by comparing two projections running from 2011 to 2025. The first projection is a hypothetical base case which excludes the direct and indirect effects of the suite of LNG projects. The second projection (labelled full-price (baseline)) deviates from the first in response to the QLD LNG expansion and subsequent shift to international parity pricing. All results are reported as deviations away from base case values. For sensitivity purposes, at the end of this note we also report a simulation in which the gas price increases from the current average price of $4.50 per Gj to $7.75 per Gj, which is half the increase assumed in the full-price (baseline). We refer to this simulation as the low-price (baseline).
National macroeconomic effects
Construction of the new LNG facilities stimulates national employment, but when building is complete, the direct stimulus ends. In the long-run, the new LNG production has a negligible impact on employment, but lowers the real wage rate.
The explanation of macro effects begins with the impacts on the national labour market. Figure 2 shows percentage deviations away from base case values in national employment (persons employed) and in the national real wage rate.
During the construction phase, and particularly the peak construction years (2014-2016), national employment rises due to the LNG-project construction. In effect, during that period building the LNG facilities lowers the national unemployment rate below what it otherwise would be.
Over time, however, the initial employment gains fall away. Construction, which is labour intensive, is replaced by production, which is capital intensive. But on top of that the increased gas prices have an adverse impact on production and employment in gas-intensive sectors, particularly in manufacturing. With an unchanged national real wage rate, on balance these forces would yield a reduction in national employment. In our modelling, we assume that employment does not fall below its base case value, by allowing the national real wage rate to be lower. As a consequence, in the long-run the impact on the national labour market of the new LNG production is revealed as a lower real rate, rather than as a change in employment.
The LNG projects are expected to increase real GDP
Figure 3 shows percentage deviations away from base case values in real GDP. The solid line shows the overall impacts. Initially, because of the LNG construction real GDP increases by around 0.3 per cent relative to its base case level (i.e., its level without the new LNG projects). This increase dissipates over time, with the long-run impact being an increase of a little less than 0.2 per cent.
The outcomes for real GDP reflect the balance of two offsetting forces. The expansion in LNG exports at the high global price results in a terms-of-trade increase for the economy. This tends to reduce the real cost of capital, leading to increased capital and increased real GDP. We call this the quantity effect. It is shown in Figure 3 by the upper dashed line. By 2020, the quantity effect adds around 0.8 per cent to real GDP. The annual increment persists thereafter.
Offsetting this, though, is the increase in gas prices for domestic use. The increase gas price allows for larger than normal profit for the local gas producers, but it also raises the cost of production for gas-using industries. Many of these industries cannot pass on these increases, and so cut production. Thus for these industries the increase in cost of gas means reduced production, employment and capital utilisation, resulting in a loss of real GDP for the economy generally. In Figure 3, this adverse price effects is shown by the lower dashed line. By 2020, the price effect subtracts around 0.6 per cent from real GDP.
National industry effects
Some industries gain production, but others lose production as a result of the LNG projects. Industries that gain most are associated with the production of electricity in Eastern markets – electricity becomes cheaper relative to gas and users re-balance their energy requirements in favour of electricity. Industries that lose most are energy intensive manufacturers unable to easily pass on the increased cost of energy.
Figure 4a shows percentage deviations in production for four industries that increase production at the national level due to the new LNG projects. Three are electricity are related, the other is construction services. Electricity (supply and generation, including from more expensive gas) is stimulated by fuel substitution effects in the manufacturing, commercial and residential sectors as users substitute away from gas towards relatively cheaper electricity for process and space heating. The other industry is construction services. All of the construction stimulus in the early years is due to the building of the new LNG facilities.
A notable omissions from Figure 4a is the national gas industry.3 Gas production for conversion to LNG expands enormously in QLD. However, this is offset by reduced gas production elsewhere. Because of the higher price, use of natural gas across the Eastern states falls, except for use in electricity generation. Gas production in WA and NT, primarily for export, also falls. Traditional exports, including exports of LNG from WA and NT are unfavourably affected by a projected strengthening of the real exchange rate due to the surge in LNG exports from QLD.
In the VUMR model, LNG and natural gas production are combined activities. LNG production and the production of natural gas for urban and industrial use is undertaken by the same industry, labelled “Gas”.
State and Territory effects
In regional terms, QLD is the only beneficiary of the new LNG projects. The economies of VIC and SA are expected to contract a little due to the adverse effects of the increased energy prices and the downturn in demand for their gas production. GSP trajectories for the other states (including NSW) are relatively unaffected.
There are no real surprises here in terms of who gains and who loses. The gain in real GSP for QLD in the longer term is projected to be around 1.7 per cent of base case GSP. The GSP losses for conventional-gas producing SA and VIC are projected to be respectively 1.0 per cent and 1.6 per cent of base case values.
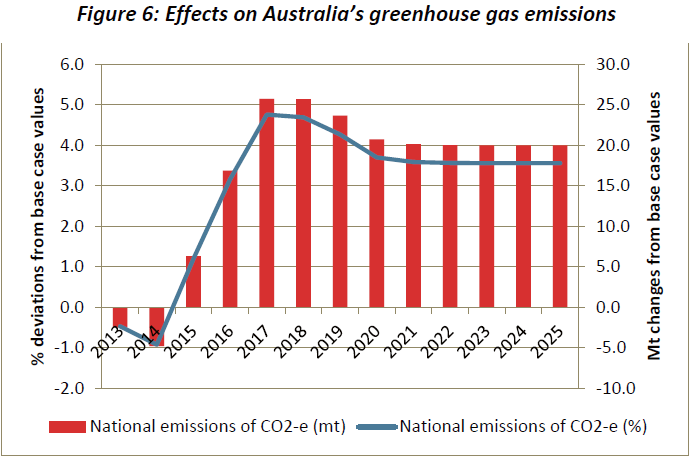
Effects on national emissions of Greenhouse gases
With the use of electricity (primarily from coal) up, emissions of Greenhouse gas rises due to the new LNG projects.
Figure 6 shows percentage and absolute (Mt) deviations in national emissions of CO2-e (greenhouse) gas. The story here is clear. In effect, domestically, the new LNG production and consequent increase in domestic gas price crowds in emission-intensive generation from coal. Thus nationally greenhouse gas emissions rise by around 4.0 per cent of base case level. This is equivalent to around 20 Mt of CO2-e.
Low-price (Baseline) compared to full-price (Baseline)
There is some uncertainty about the future international LNG price. The price assumption for the full-price (Baseline) is shown in Figure 1. To gauge the sensitivity of the modelling to changes in that assumption, we have simulated an alternative Baseline in which the price rises from the current average price of $4.50 per Gj to $7.75 per Gj, which is half the increase assumed in the full-price (baseline). Figure 7 shows percentage deviations in real GDP implied in both simulations. In the years to 2018, the absolute difference in results is relatively small, with the full-price (baseline) being less stimulatory than the low price (Baseline). The difference is magnified in the long-run. Roughly, with half the price increase, we get nearly twice the increase in real GDP.
This rule follows for most of the other results. For the long-run, in the low price (Baseline) scenario relative to the full-price (Baseline) scenario the sign of the deviations is the same but the magnitude of the deviations is roughly doubled.
Advertisement
The money charts are numbers three and seven. The first shows that with LNG prices at $10 per Gj (delivered to Asia for $16/Gj) the net welfare effect of the LNG boom for the nation is a very small gain because the volume gains counted in GDP are offset by the income falls resulting from high gas prices crowding out other sectors like manufacturing, big utility price increases for eastern households, as well as the profits mostly flowing offshore to the foreign owners.
That’s a terrible result given national income is a better measure of economic welfare than is GDP, which is really an arbitrary measure of whirring widgets.
The last chart is a poetic illustration of the dynamic. It is a second modelling based upon lower LNG prices than those used in the first chart. You will notice that as the price of exported gas falls from $10 per Gj to $6 per Gj, the net benefits to the nation rise.
Advertisement
That’s right, the more the LNG price drops, the better off is the east coast economy overall because the lower price decreases the negative impacts on other potentially crowded out sectors more swiftly than the downside that the gas sector is making less money.
LNG has given Australia some kind of super-malignant dose of Dutch Disease and until we treat it with more stringent domestic gas reservation and tax reforms it will only get worse.
David Llewellyn-Smith is Chief Strategist at the MB Fund and MB Super. David is the founding publisher and editor of MacroBusiness and was the founding publisher and global economy editor of The Diplomat, the Asia Pacific’s leading geo-politics and economics portal.
He is also a former gold trader and economic commentator at The Sydney Morning Herald, The Age, the ABC and Business Spectator. He is the co-author of The Great Crash of 2008 with Ross Garnaut and was the editor of the second Garnaut Climate Change Review.