Westpac’s excellent February 2019 Housing Pulse contains interesting information on mortgage arrears, which are rising across the four major markets:
Mortgage arrears provide a timely indicator of urgent or distressed sales – the presence of which can precipitate significant price weakness. For most existing home owners there is a degree of optionality when it comes to transacting in the housing market – a decision to sell can usually be delayed if market conditions look likely to disappoint. However, for owners that are struggling to meet their debt servicing obligations, selling may be a more urgent requirement with vendors more willing to accept lower prices in order to achieve a sale.
The most readily available measure for the Australian market is Standard & Poor’s SPIN data based on the performance of securitised mortgages. These show the proportion of loans by value that are over 30 days in arrears – in most cases meaning they have missed at least one repayment. The monthly measure goes back to 1996 and is available by state.
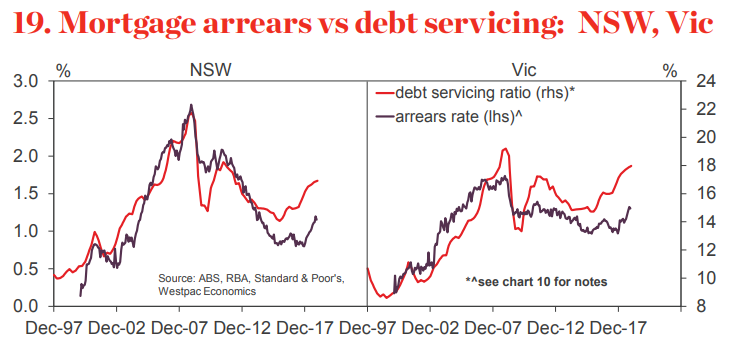
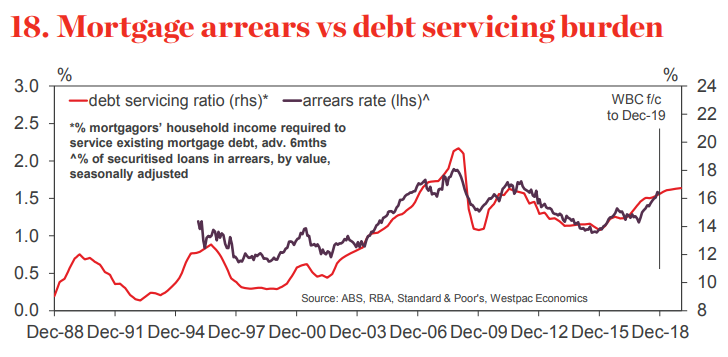
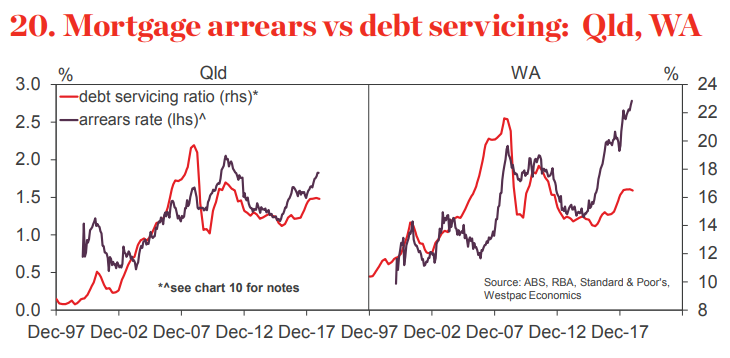
Charts 18-20 show arrears rates nationally and across the major states compared to estimates of the debt servicing ratio for mortgagor households. The comparison helps identify the extent to which shifts in arrears may be due to budget pressures as distinct from market specific factors such as oversupply.
Note that while it is the best available measure, securitised loans are not always an accurate reflection of arrears across the wider system. Differences have likely been compounded by lower major bank issuance in recent years – a higher share of ‘non-conforming’ loans alone has added 7bps to the total SPIN arrears rate. Recent reports from the major banks suggest systemwide arrears have shown a much milder rise over 2018.
That said, the latest SPIN data is showing a notable lift in arrears since mid-2018 broadly consistent with estimated increases in debt servicing costs following increased to mortgage interest rates (the estimate incorporates changes to rates on investor and interest only loans as well as standard owner occupier loans rates). As at Nov 2018, the arrears rate was 1.6%, up from 1.2% a year ago (about 5bps of the rise reflecting the shifting share of non conforming loans). That is a touch above long run averages but a short of the previous peaks in 2011-12 and 2008.
The picture by state shows rises across every jurisdiction, again suggesting interest rate increases are a key driver. Despite the recent lift, arrears remain considerably lower in NSW (1.2%) and Vic (1.3%) with the rise less pronounced than might have been suggested by the move in debt servicing ratios in these states.
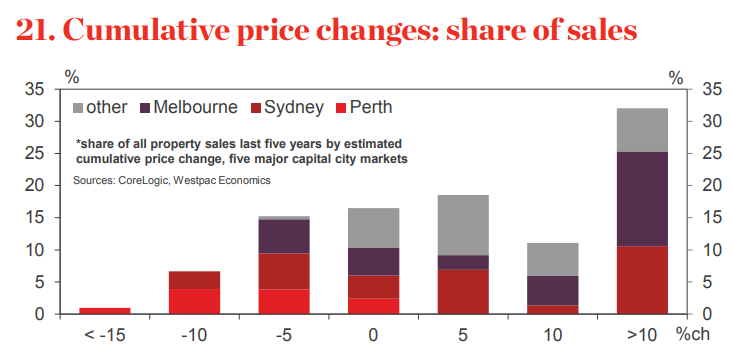
In contrast, arrears rates are more elevated in Qld (1.8%) and very high and rising more quickly in WA (2.8%). The latter may also be reflecting a more significant incidence of balance sheet problems across WA households with a mortgage. Perth’s dwelling price correction has been running for much longer than the adjustments in other capital city markets, with more buyers likely to have experienced cumulative price declines in recent years. Chart 21 shows an estimate of the share of property sales over the last 5yrs by the cumulative price change (based on city level moves in house and unit prices. It suggests that around 1% of sales have seen prices decline by over 15%, all of these being in the Perth market.
Leith van Onselen is Chief Economist at the MB Fund and MB Super. He is also a co-founder of MacroBusiness.
Leith has previously worked at the Australian Treasury, Victorian Treasury and Goldman Sachs.