Westpac has released its February 2019 Housing Pulse, which projects that Australia’s housing correction will deepen, with “prices, turnover and lead indicators for dwelling construction all sliding into year-end”. Moreover, “further declines near term” will “exert a more significant spillover drag on the wider economy”:
In particular, a tightening in lending standards may have compounded what were already negative market dynamics following a drop in investor activity and initial price correction. This makes it a difficult market to read – sentiment points to further declines near term but lending-related developments could again impact.
Note that Westpac has downgraded its outlook with housing-related weakness now expected to exert a more significant spillover drag on the wider economy. In turn, we now expect the RBA to lower the Cash Rate with two 25bp cuts in Aug and Nov.
This month’s report again finds housing market conditions varying across states – weakest in NSW, Vic and WA, steadier in Qld and SA, and slowing but still relatively firm in Tas. The deterioration in both market conditions and sentiment over the last 3mths has been fairly broad-based…
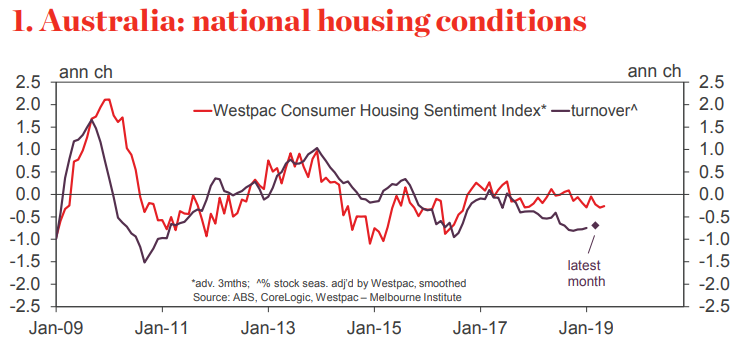
Data since our last report show Australia’s housing markets posted a very weak finish to 2018. The Sydney Melbourne led correction that began in 2017 intensified and broadened into year end. Conditions weakened across most geographies and segments although the two major eastern cities and Perth continue to see more pronounced declines. The breadth and extent of falls suggest it is being driven by a combination of weaker demand and tighter loan standards from some lenders.
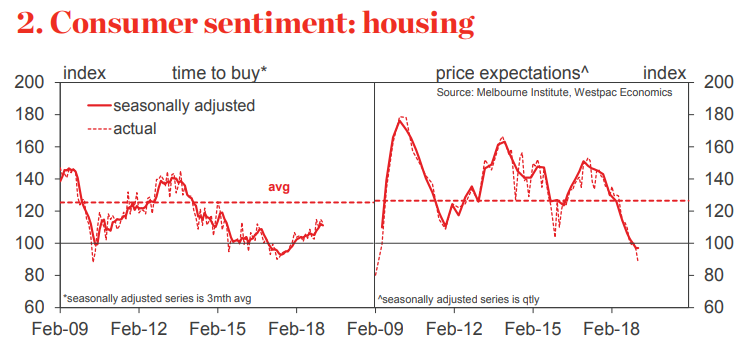
Sentiment has deteriorated since Nov: the improvement in ‘time to buy’ assessments since mid 2017 stalling and price expectations again pared back sharply. Unemployment expectations have been steady but risk aversion has risen to record highs. Overall, recent market weakness has been more pronounced than the softer sentiment mix would indicate.
Turnover plumbed new lows in the Dec quarter with just 3.6% of the dwelling stock changing hands – the lowest since 1987. That compares to 4.4% in the final quarter of 2017. All major states recorded declines in the quarter.
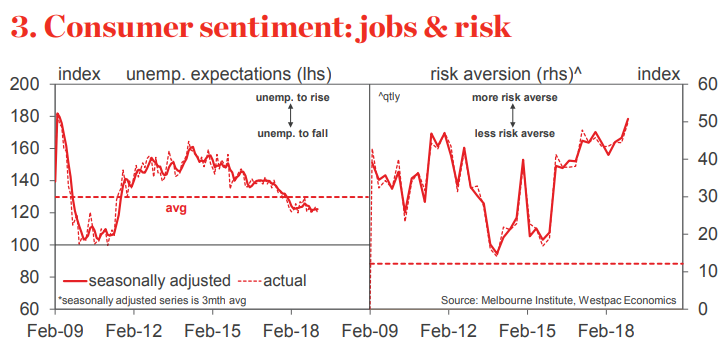
Auction markets finished the year with clearance rates in Sydney and Melbourne around 48%. Rising preauction withdrawals continue to conceal the extent of weakness. Results from early Feb hint at a slight firming but this is on very light volumes with a true test coming as we head into early Mar.
Prices nationally are now down 6.1% from their 2017 peak but down 10% across the Sydney and Melbourne markets on a combined basis. Perth prices are down 5.6%yr. Prices are fl at in Brisbane, up slightly in Adelaide, and showing steady but slower gains in Hobart.
Nationally, the Westpac Melbourne Institute ‘time to buy a dwelling’ index has slipped 1.8% since Nov but is still up 8.6%yr. Improving affordability continues to see a lift in NSW and Vic, the latter reaching a 5yr high in Feb, but sentiment has become more unsettled in other states.
The Westpac–MI Consumer House Price Expectations Index posted another sharp 11% drop over the 3mths to Feb, hitting a new historical low since we began compiling the index in May 2009. Weakness remains more pronounced in NSW and Vic, with just over half of consumers in these states expecting prices to be lower in a year’s time. The more positive views in other states are also starting to show signs of softening with notable pull backs in Qld and WA.
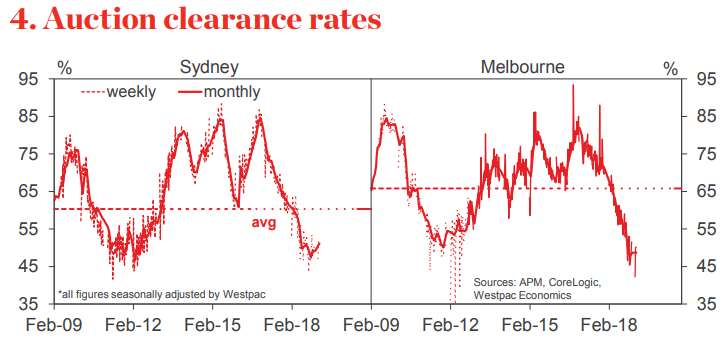
The Westpac Melbourne Institute Unemployment Expectations Index edged 0.4% lower over the 3mths to Feb, a slight improvement (recall that lower reads mean more consumers expect unemployment to fall in the year ahead). At 120 the index is at a 7yr low and considerably better than the long run average of 130 but is little changed on a year ago.
Consumer risk aversion intensified in late 2018, the Westpac Consumer Risk Aversion Index lifting from 45.6 in Sep to 51 in Dec, a new record high. The ‘wisest place for savings’ question the index is based on shows only 10% favouring ‘real estate’, a 45yr low.
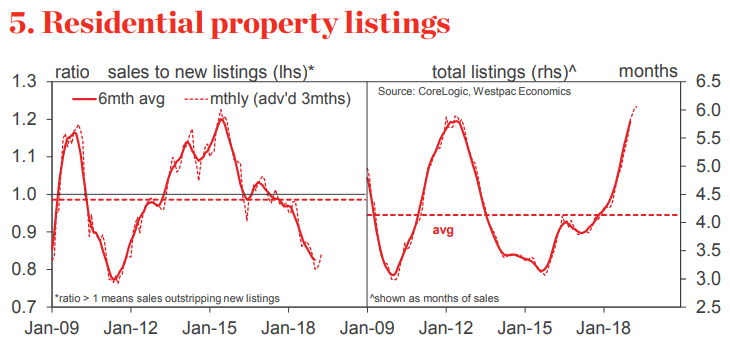
Listings highlight difficult selling conditions. Despite a 5.7% decline in new listings across the major capital cities over the second half of 2018, the much sharper drop off in sales means unsold inventory is rising quickly and at high levels in relation to monthly sales…
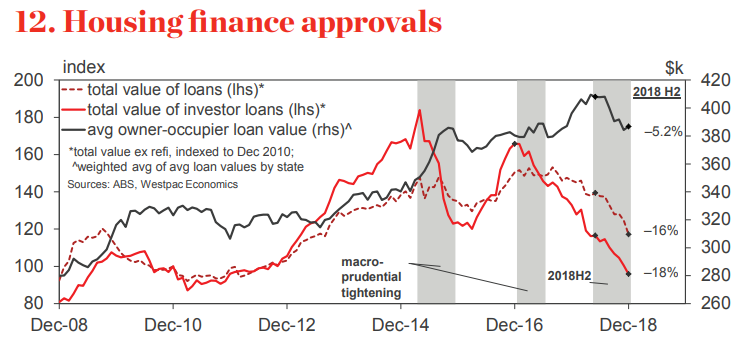
The second half of 2018 is also notable for a more material decline in average loan sizes (see chart 12). Some of this may refl ect reductions in assessments of maximum borrowing capacity although lenders report few customers borrow their assessed maximum. The decline in average loan size will also refl ect reduced borrowing requirements due to lower prices and the reduced housing equity for ‘upgraders’. However, the decline in average loan size in states unaff ected by price declines suggests some other factors are at play as well.
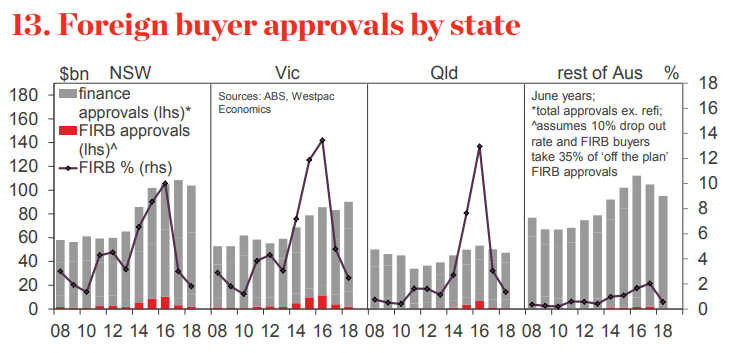
The latest FIRB annual report casts more light on another aspect of housing policy, the tightening in conditions for foreign buyers (both locally and aff ecting capital outfl ows from other countries). It points to a further 50% drop in foreign residential property purchases in 2017-18, marking an 83% collapse over last two years.
Leith van Onselen is Chief Economist at the MB Fund and MB Super. He is also a co-founder of MacroBusiness.
Leith has previously worked at the Australian Treasury, Victorian Treasury and Goldman Sachs.