
CoreLogic’s latest dwelling sales data reveals more bad news for those groups heavily reliant on property transactions, including real estate agents and state governments (via stamp duty). It also points straight down for house prices.
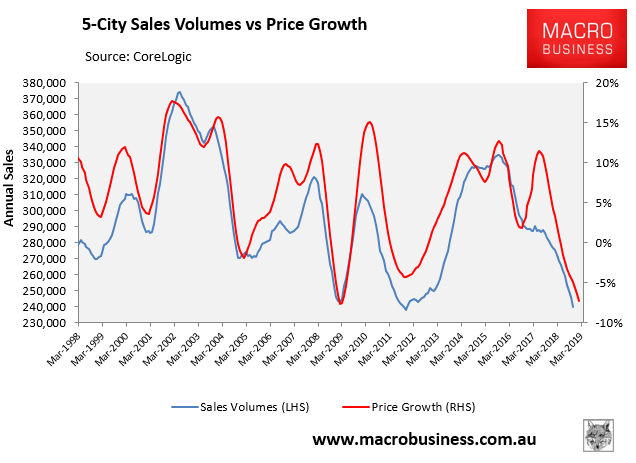
The next chart plots annual sales volumes across the five major markets to October 2018, which are falling fast and plumbing levels not seen since the 2010-12 housing bear market:
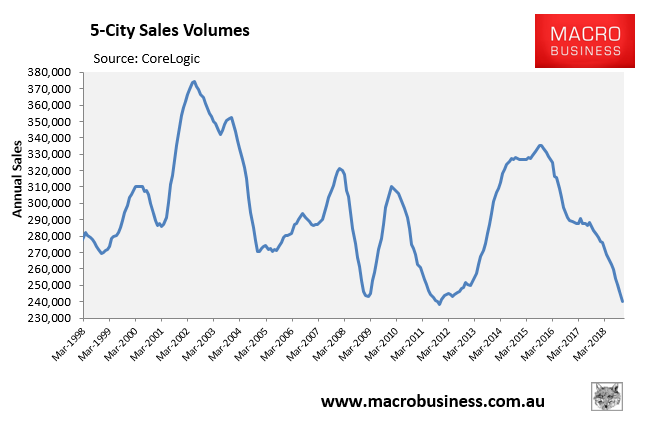
At the 5-city level, sales volumes are down 28% since the August 2015 peak.
The next charts plot annual sales volumes across each major capital:
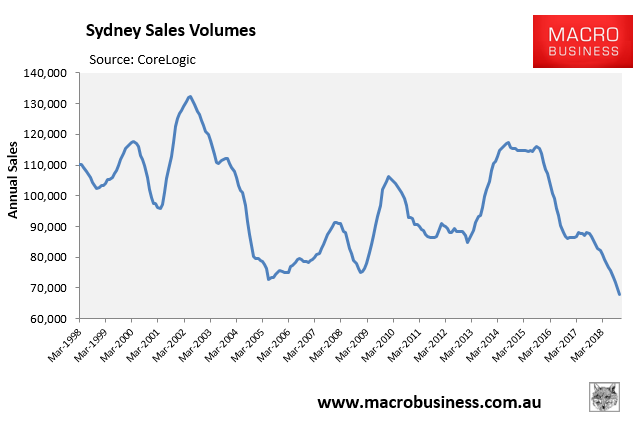
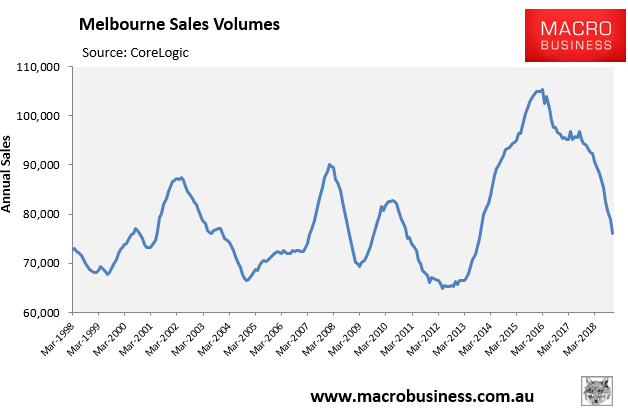
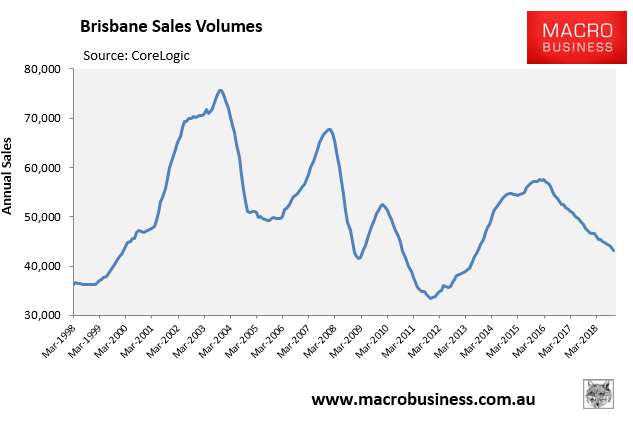
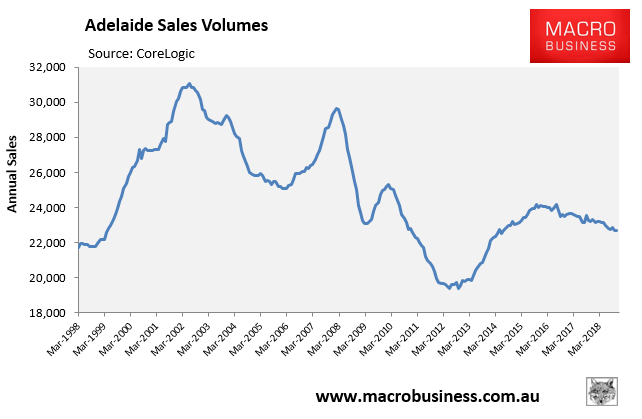
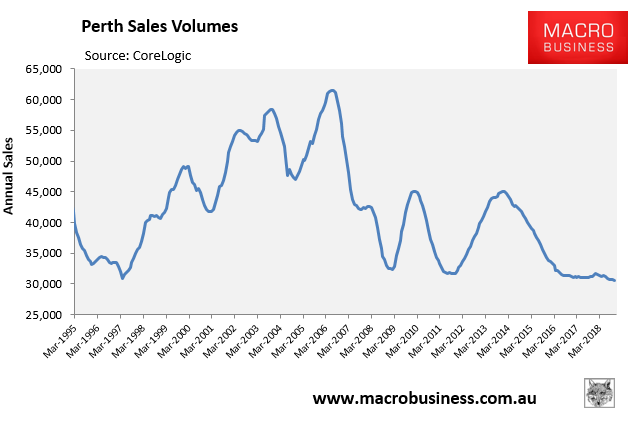
Sydney (-42%), Melbourne (-28%), Brisbane (-25%), and Perth (-32%) are all down significantly from their most recent peaks.
The following charts plot the annual changes in sales volumes and dwelling values, as measured by CoreLogic, which shows a very strong correlation:
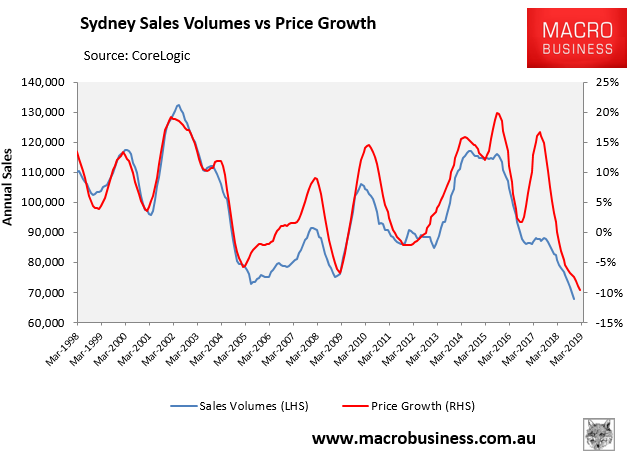
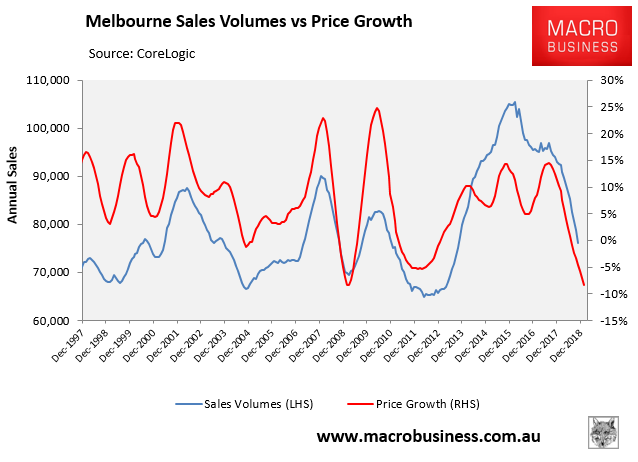
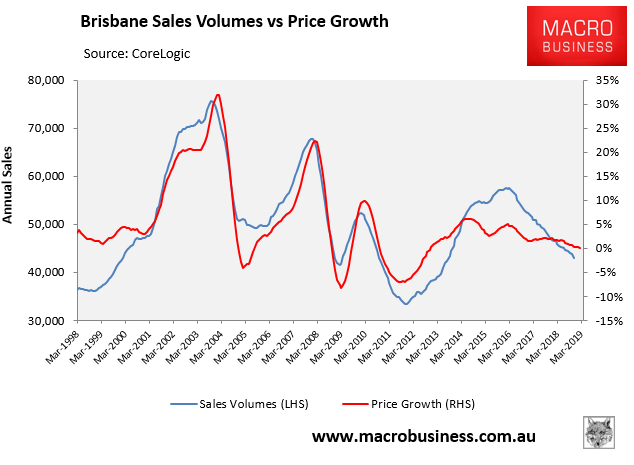
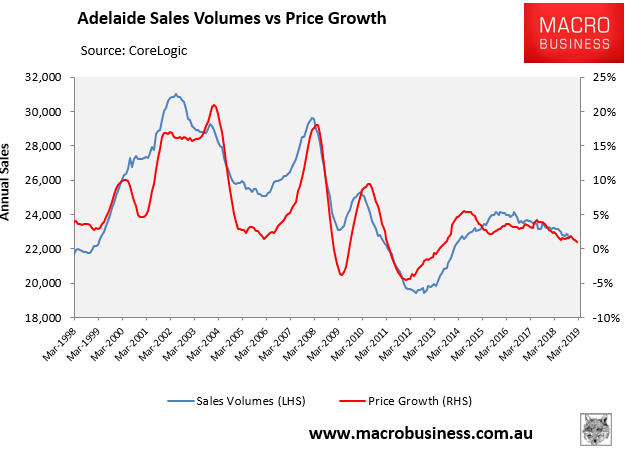
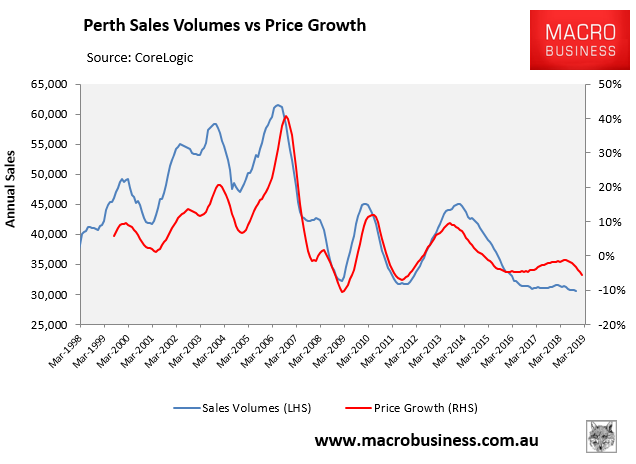
The collapse in sales volumes suggests that Sydney’s, Melbourne’s and Perth’s dwelling values will continue to fall, whereas Brisbane’s and Adelaide’s could follow.
