
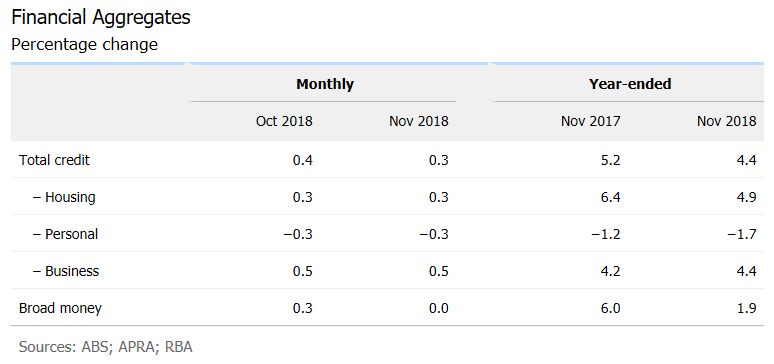
The Reserve Bank of Australia (RBA) released its private sector credit aggregates data for the month of November 2018:
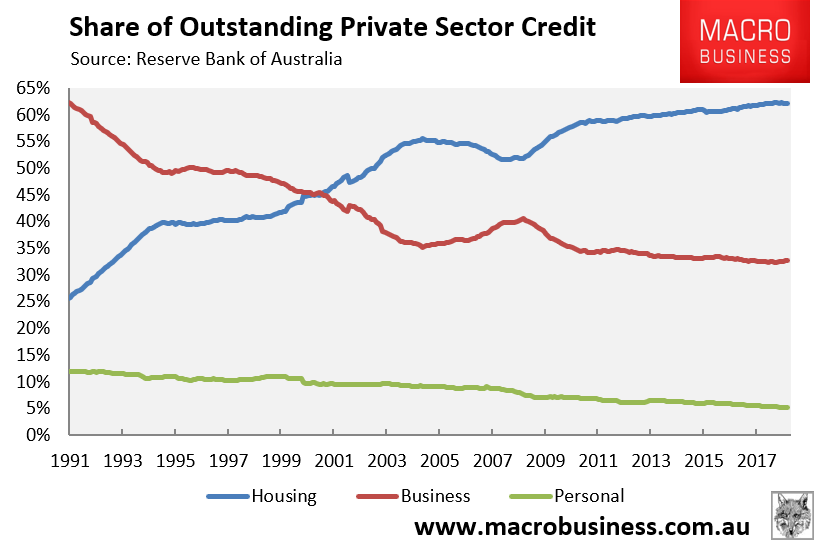
A chart showing the long-run breakdown in the components is provided below:
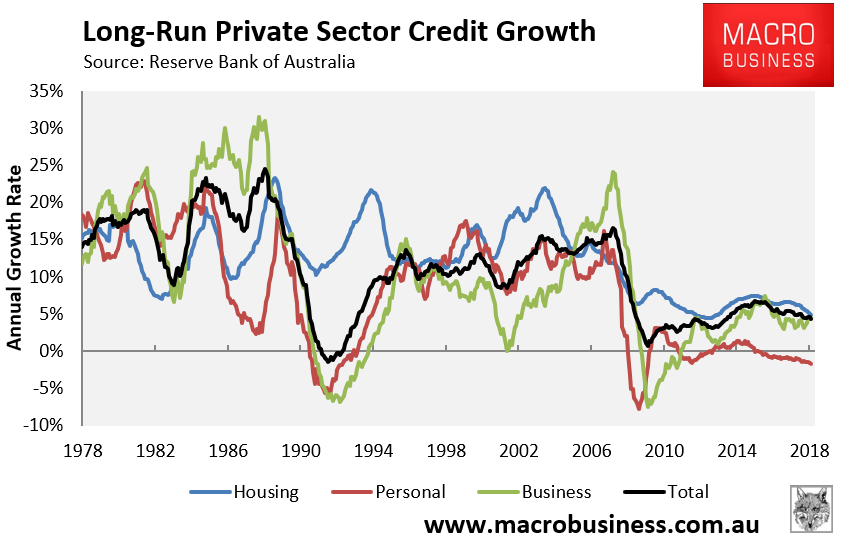
Personal credit growth (-0.3% MoM; -0.6% QoQ; -1.7% YoY) is still in the gutter, whereas business credit growth (0.5% MoM; 1.7% QoQ; 4.4% YoY) and housing credit growth (0.3% MoM; 0.9% QoQ; 4.9% YoY) are stronger.
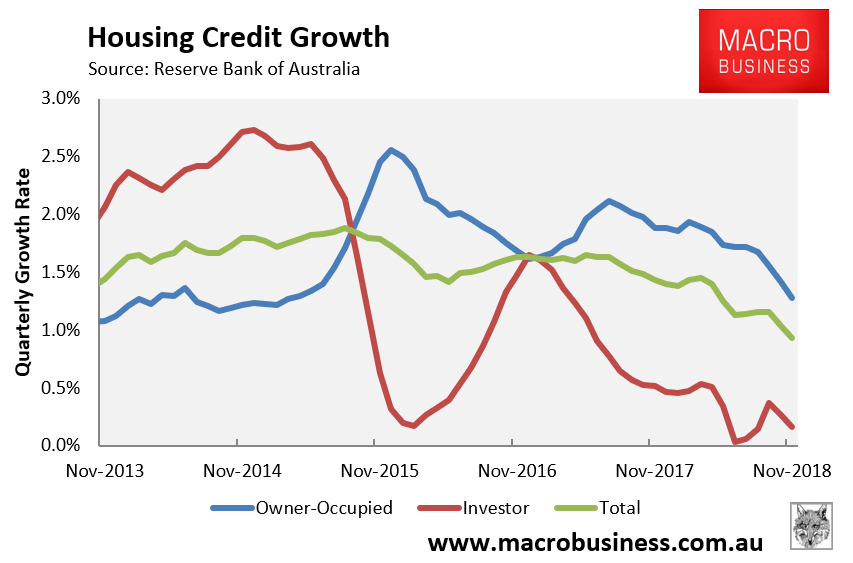
A long-run breakdown of owner-occupied credit (0.39% MoM; 1.27% QoQ; 6.82% YoY) and investor credit (0.00% MoM; 0.16% QoQ; 1.12% YoY) is provided below:
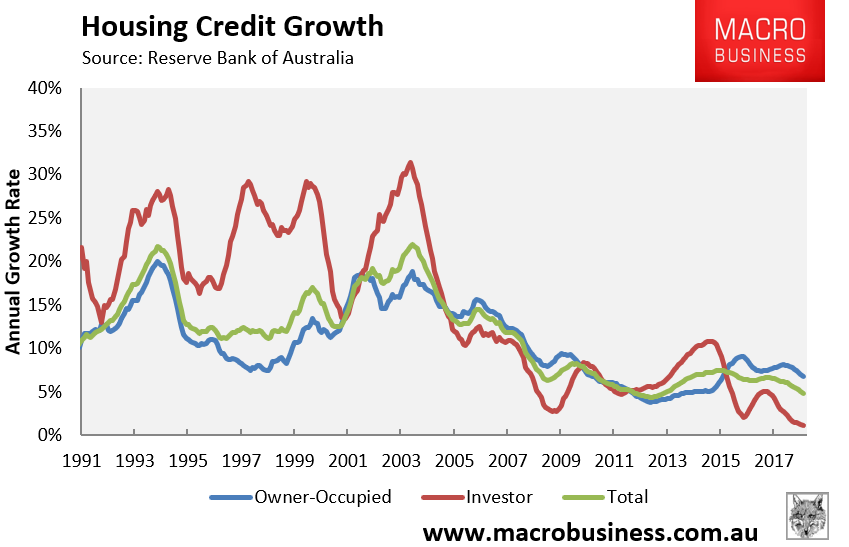
Annual investor credit growth has tanked to an all-time low, whereas owner-occupied credit is also weakening. Combined, overall housing credit growth is trending down fast:
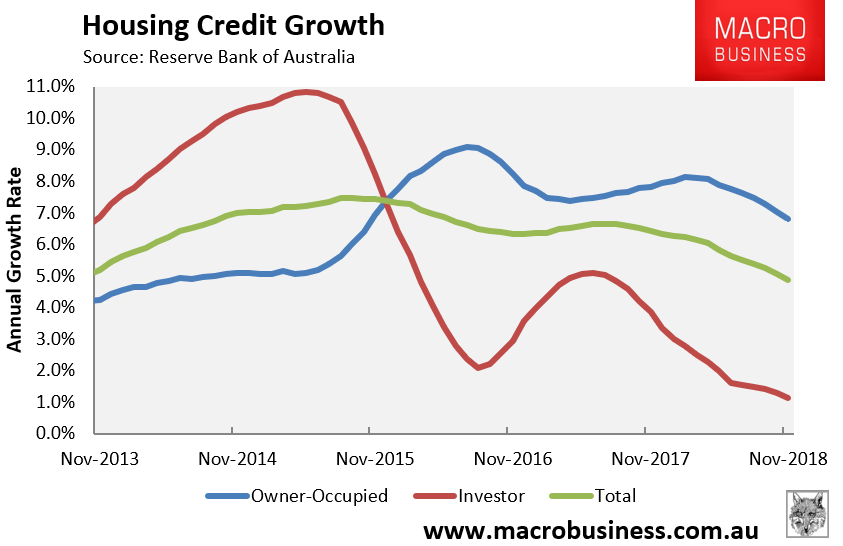
The below chart shows that quarterly housing credit growth gapped down further in November:
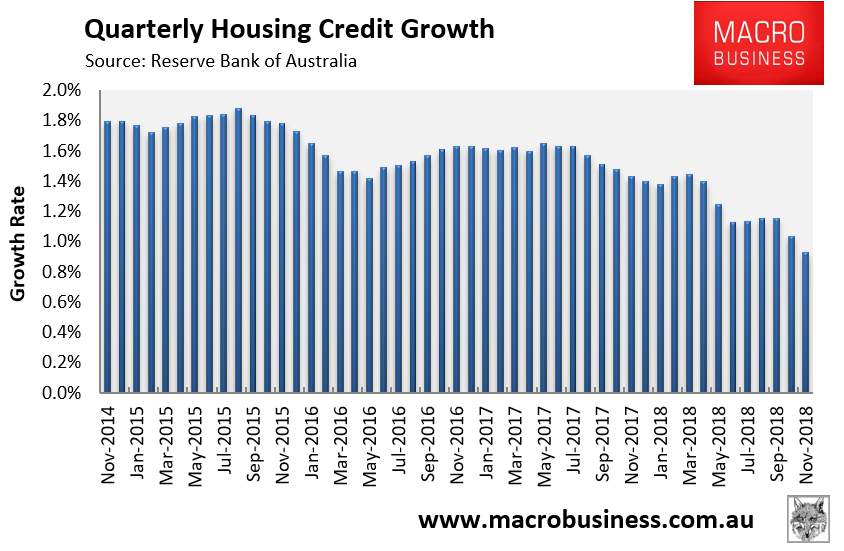
Driven by a combined fall in both owner-occupied and investor lending:
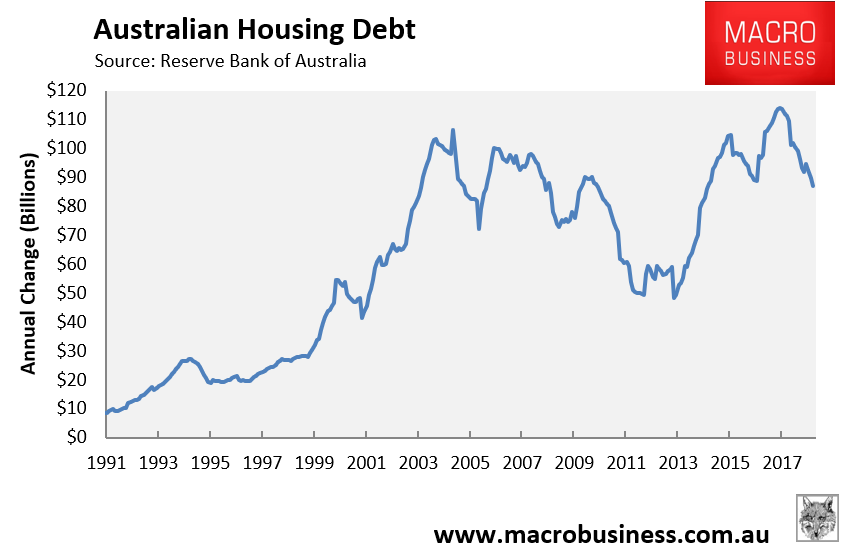
The annual dollar value of housing credit issued also fell and remains down to $27 billion (-24%) since peaking in August 2017:
Finally, the share of loans going to housing was 62.10% in November – fractionally below all-time highs. By contrast, the share of total loans to businesses was just 32.75% – fractionally above all-time lows:
Overall, housing credit growth continues to weaken, driven by a desertion of both owner-occupiers and investors, which is reflected by the fall in house prices.
unconventionaleconomist@hotmail.com
