by Chris Becker
CoreLogic are out with their first results of the new year and it’s not rosy if you’re a speculator, with a near 9% year on year fall in Sydney, and nearly 5% overall across the nation. Here’s some highlights:
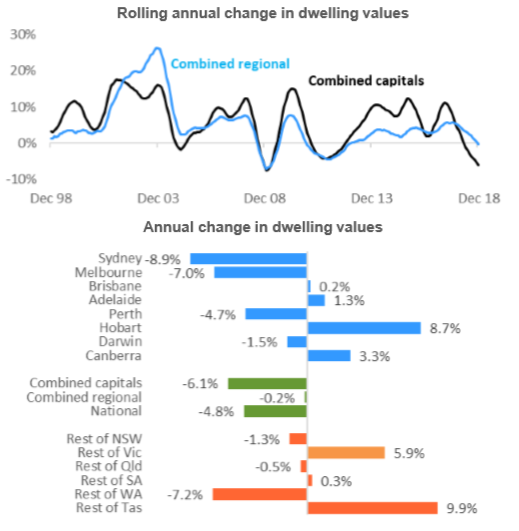
Housing market conditions ended the 2018 calendar year on a weak note, with the rate of decline consistently worsening over the year. National dwelling values were down 2.3% over the December quarter; the largest quarter on quarter decline since the December quarter of 2008. According to the CoreLogic December home value index results, the downturn in Australian housing conditions accelerated through 2018, driven by consistently larger quarter-on-quarter declines in Sydney and Melbourne together with a reprisal in Perth’s rate of decline and slowing conditions across the remaining capital cities and most regional markets. The year finished with national dwelling values down 4.8%, ranging from an 8.9% fall in Sydney values through to a 9.9% rise in values across regional Tasmania.
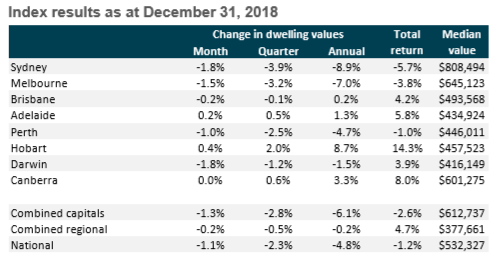
Highlights over the three months to December 2018:
-
Best performing capital city: Hobart +2.0%
-
Weakest performing capital city: Sydney -3.9%
-
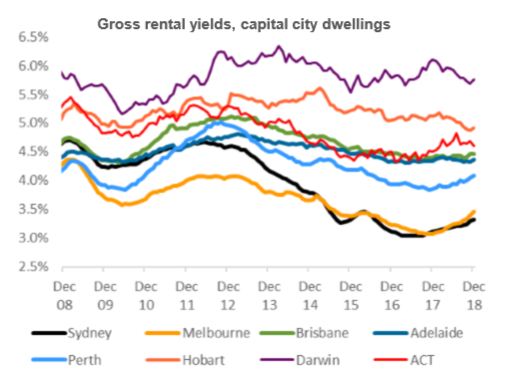
Highest rental yield: Darwin 5.8%
-
Lowest rental yields: Sydney 3.3%
Most regions of Australia recorded a weaker housing market performance in 2018 relative to 2017. Four of the eight capital cities recorded a decline in dwelling values over the calendar year led by Sydney (-8.9%) and Melbourne (-7.0%), while values were also lower across Perth (-4.7%) and Darwin (-1.5%). The remaining capital cities recorded a rise in values, although conditions weren’t as strong as 2017 with every capital city recording a weakening in the pace of growth or an acceleration in the rate of decline over the year.
According to CoreLogic head of research Tim Lawless, the broad weakening in housing market conditions in 2018 highlights that this slowdown goes well beyond the correction in Sydney and Melbourne. He said, “Although Australia’s two largest cities are the primary drivers for the weaker national reading, most regions around the country have reacted to tighter credit conditions by recording weaker housing market results relative to 2017. The two exceptions were regional Tasmania, where the pace of capital gains was higher relative to 2017 resulting in a nation leading 9.9% gain in values over the 2018 calendar year, and Darwin, where the annual rate of decline improved from -8.9% in 2017 to -1.5% in 2018.”
The December CoreLogic housing market results take national dwelling values down by a cumulative 5.2% since peaking in October 2017. Values across the combined capitals are down a larger 6.7% since peaking, while regional dwelling values have been more resilient to falls, down by 1.5%. Although Sydney and Melbourne recorded the weakest conditions, the peak to current declines are much less severe relative to Perth and Darwin where values have been falling since mid-2014. Sydney values are now 11.1% lower relative to the July 2017 peak and Melbourne values are down 7.2% since peaking in November 2017. The downturn has been running much longer in Perth and Darwin, resulting in cumulative falls of 15.6% and 24.5% respectively.
At the end of 2018, Sydney values were back to where they were in August 2016, while Melbourne values are back to February 2017 levels. Perth values are back to levels last seen in March 2009 and Darwin dwelling values are at October 2007 levels. Housing market conditions have also shown substantial differences across the broader valuation cohorts. The top quartile of the market, based on dwelling values, has underperformed relative to the lower quartile. Nationally, Mr Lawless said this trend can be explained by the weaker conditions in Sydney and Melbourne, where housing values remain substantially higher than other markets.
Melbourne’s top quartile housing market has led the way with dwelling values down 11.2% over the year, while the lower quartile of the market has remained in subtle growth territory over the year (+0.5%). In Sydney, upper quartile dwelling values are 10.0% lower over the year, compared with a 6.8% decline across the lower quartile of the market. Mr Lawless said, “The stronger performance across lower value properties likely reflects both affordability challenges and lending policies focused on reducing exposure to borrowers with high debt to income ratios. These factors, as well as incentives for first home buyers in New South Wales and Victoria, are likely channeling market activity towards the lower range of dwelling values.”
The best and worst performing areas Mr Lawless said, “Overall, housing market conditions showed a diverse performance over the year, demonstrating how varied the market is based on location and price points.” The strongest capital city sub-regions were confined to Hobart, Canberra, Brisbane and Adelaide where housing prices are generally more affordable relative to household incomes (although housing affordability has rapidly deteriorated across Hobart). Outside of Hobart, where dwelling values were 8.7% higher over the year, even the best performing regions returned a relatively mild annual growth rate. Seven of the top ten sub-regions returned an annual gain of less than 3%. Mr Lawless said, “Such a soft result amongst the best performing areas highlights that housing market weakness is broad-based and not just confined to Sydney and Melbourne.”
The weakest capital city sub-regions were primarily located across the regions of Sydney, which comprised eight of the top ten weakest capital city markets in 2018. Despite Sydney’s dominance of the weakest performing areas, Melbourne’s Inner East, which includes some of the city’s most expensive properties, topped the list for the largest annual decline in dwelling values. Dwelling values were down 13.4% across the Inner East, followed closely by Sydney’s Ryde where values were 13.3% lower.Areas across regional Australia returned a stronger growth performance relative to the capital cities; likely due to better housing affordability, more sustainable long term growth trends and improving economic and demographic conditions. The strongest regional performers were in Tasmania and Victoria, with sub-regions in these states comprising seven of the top ten best performing regional markets. The weakest regional areas comprise a broader range of locations from agricultural regions where drought conditions and low demand are weighing down the market, through to previously strong markets adjacent to Sydney such as Newcastle and Lake Macquarie, Illawarra, the Southern Highlands and Shoalhaven.
Overall, Mr Lawless believes that the broad-based weakening in housing market conditions over the 2018 calendar year should come as no surprise. He said a variety of factors are having a negative impact on the market that could persist into 2019.Namely, access to credit has been the most significant factor weighing down housing market conditions over the year. While various macro-prudential policies have been in place since 2015, lenders have been far more conservative in their lending practices than these policies have dictated. Interest-only lending has tracked well below the recently discarded 30% limit, credit growth for investment purposes is virtually flat-lining and owner occupier credit growth slowed sharply over the second half of the year. Lenders are generally seeking out larger deposits from borrowers and have become much more forensic in detailing borrower expense profiles and servicing capacity.
Mr Lawless said, “Despite the macro-prudential policies implemented by APRA being removed, access to finance is likely to remain the most significant barrier to an improvement in housing market conditions in 2019. “Lenders are understandably risk averse against a backdrop of falling dwelling values, high household debt, rising supply and heightened regulatory focus following the banking royal commission. “Credit availability has also been of concern for the Council of Financial Regulators, with the minutes from its December meeting stating that some banks may be taking an overly cautious approach to lending.
“Additionally, late last year, it was reported that the Reserve Bank was in discussions with leaders of the Big Four banks around making credit more readily available, implying that the Reserve Bank is somewhat concerned with how difficult it is to access credit currently.” Another factor cited by Mr Lawless as impacting on housing conditions is consumer sentiment. The latest Westpac/Melbourne Institute Consumer Sentiment survey showed that overall sentiment levels remain around neutral, however measures of housing sentiment remain pessimistic. “Purchasing a residential property is one of the highest commitment decisions a household will make and low levels of confidence are likely to continue to dampen housing demand,” Mr Lawless said.
Dragging market conditions down even further over the year were the substantial reduction in foreign buyer activity, higher levels of housing supply, a reduction in overseas migration and a subtle rise in mortgage rates. Looking forward, Mr Lawless is expecting many of these factors will continue to act as a drag on housing market conditions over the coming year. He said, “With a federal election likely to be held sometime in May, we may see a further negative impact on confidence, especially amongst investors who will be impacted by changes to taxation policy should there be a change of government.”“On a positive note, interest rates are set to remain close to historic lows and migration is likely to remain high (albeit lower than last year) which will help to keep a floor under housing demand.”
“With stock levels remaining elevated, buyers will be in the driver’s seat when it comes to choosing a property and negotiating on price. Conversely, vendors will need to be cognisant of market conditions and set their price expectations and marketing strategies accordingly. ”An important litmus test for the market will occur in February, typically at this time we see the number of advertised listings ramp-up following the Christmas/New Year slowdown. If listing levels return to or exceed levels from late 2018 it could lead to even weaker housing conditions as buyers are spoilt for choice,” Mr Lawless said.