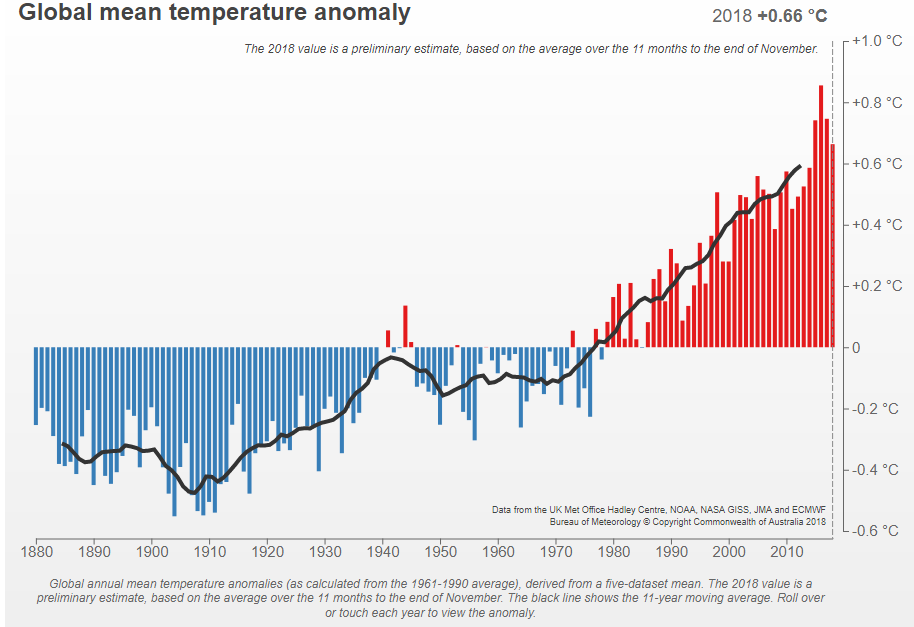
Aussie Aussie Aussie! Another record for the ages with the Bureau of Meteorology revealing that 2018 was the third hottest year on record, with global temperatures in 2018 to be the fourth-warmest year on record since 1880 (2015-2017 being the warmest):
Drought prevention and relief, plus water security issues have never been more important, but I’m sure the non-realists in the Coalition are going to put the “fake news” spin on the BOM’s full report, available here:
Australia’s area-averaged mean temperature for 2018 was 1.14 °C above the 1961–1990 average. Maximum temperatures were the second-warmest on record at 1.55 °C above average, coming in behind +1.59 °C in 2013. Minimum temperatures were 0.73 °C above average, the 11th-warmest on record.
2018 annual mean temperatures compared to historical temperature observations. See also maxima and minima.
The 11-year mean temperature for 2008–2018 was the highest on record at 0.77 °C above average. Only one of Australia’s warmest ten years occurred before 2005, and nine of the last ten years have been warmer than average. Warming associated with anthropogenic climate change has seen Australian annual mean temperatures increase by just over one degree since 1910. Most of this warming has occurred since 1950.
The Indian Ocean exerted a strong influence on Australia’s climate during 2018. Dry conditions persisted over most of Australia during spring, associated with the positive phase of the Indian Ocean Dipole (IOD). The tropical Pacific Ocean had less of an influence, starting the year with a very weak La Niña that decayed during February, and had little impact on Australian rainfall, before moving into neutral conditions (neither El Niño nor La Niña). While there were signs of a developing El Niño from late winter, conditions failed to progress to a fully-fledged event by year’s end.
Annual mean temperatures for 2018 were above average for nearly all of Australia, and very much above average for most of the mainland except parts of Western Australia, mostly in the north and west, and parts of eastern Queensland. It was amongst the six warmest years on record for all States and the Northern Territory, and the warmest on record for New South Wales.
All capital cities except Melbourne and Perth ranked amongst the eight warmest years on record for annual mean temperature. Hobart had a particularly warm year, with annual mean temperatures the second-warmest on record.
Days were exceptionally warm for Canberra (annual mean maxima warmest on record) and Darwin (second-warmest on record), and also warm for Brisbane (fourth-warmest on record) and Sydney (fifth-warmest on record). Nights were warmer than average for each of those cities, but not especially so. Both days and nights were much warmer than average for Adelaide (maxima eighth-warmest on record, minima eleventh-warmest on record), and warmer than average for Melbourne, although outside the top ten. In Perth days were warmer than average.
2018 annual rainfall compared to historical rainfall observations. About deciles.
Nationally-averaged rainfall for 2018 was 412.8 mm, 11% below the 1961–1990 average of 465.2 mm, making it Australia’s 39th-driest year in a record spanning 1900 to the present.
Rainfall for the year was very low over the southeastern quarter of the mainland (seventh-lowest on record), with much of the region experiencing totals in the lowest 10% of historical observations. Annual rainfall was above average between the northwest coast of Western Australia and the southeast of that State. Rainfall was particularly low over the mainland southeast from April, with rainfall deficiencies increasing during the year for many areas. September was record-dry, but the final three months of 2018 were wetter in some areas.
The dry conditions over the southwest of Western Australia and the southeast of the continent during 2018 were likely driven by both natural variability and climate change. While low rainfall has persisted over many areas of the southeast for more than 12 months, the positive IOD in spring significantly exacerbated drought conditions across parts of Queensland, New South Wales, Victoria, South Australia and Tasmania. The dry conditions were also somewhat consistent with long-term rainfall trends, as detailed in the 2018 State of the Climate Report. Persistent very high temperatures throughout the year also contributed to record high rates of observed pan evaporation for winter and spring in New South Wales and Queensland.
The year was particularly dry for Melbourne, its 27th-lowest annual rainfall on record, in 161 years of observations. Adelaide, Sydney, Brisbane, and Canberra all experienced a drier than average year. For Darwin, the year was slightly wetter than average, while annual rainfall was near average for Hobart and Perth.


