
Via Goldman today comes some technical analysis:
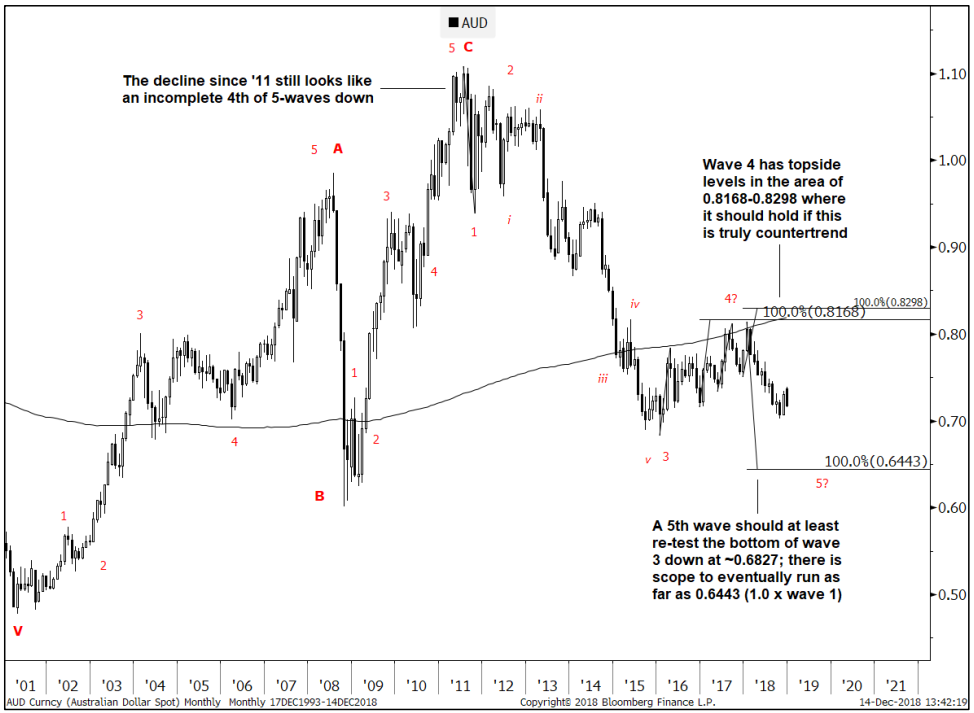
The market is in a 5th wave of a sequence that started at the ’11 highs
- In short, this could be interpreted as the Vth wave of a sequence that started at the ’11 highs. Going back historically, wave IV began in Jan. ’16, and formed a clean ABC counter-trend advance, targeting 0.8168 (the high reached 0.8125). The sell-off since Jan. ’18 has looked fairly impulsive, increasing confidence in the theory that this is in fact a Vth wave.
- At very minimum a wave 5 will typically retrace the full extent of its move since the bottom of wave 4 which in this case would mean re-testing the lows from Jan. ’16 at 0.6827. It could also eventually extend as far down as 0.6432 (if equal to the length of wave 1).
- Initially focused on the Jan. ’16 low at 0.6827. Scope to eventually reach 0.6432
My own view is that Elliot Wave theory is voodoo but there you go. I still think that the fundamentals point us this way given markets have are already moving to price a US slowdown but not the looming Chinese version. Our house view is that won’t deliver enough stimulus until it sees the economy slowing markedly in a rerun of 2015.
