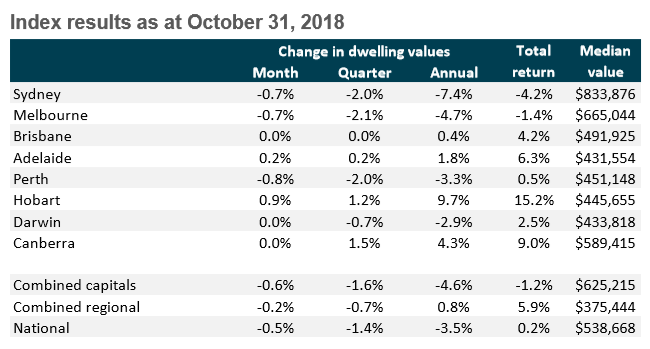
Following yesterday’s post on CoreLogic’s daily dwelling values index results for October, CoreLogic has released its full results, which also cover the smaller capitals and regional areas (see next table).
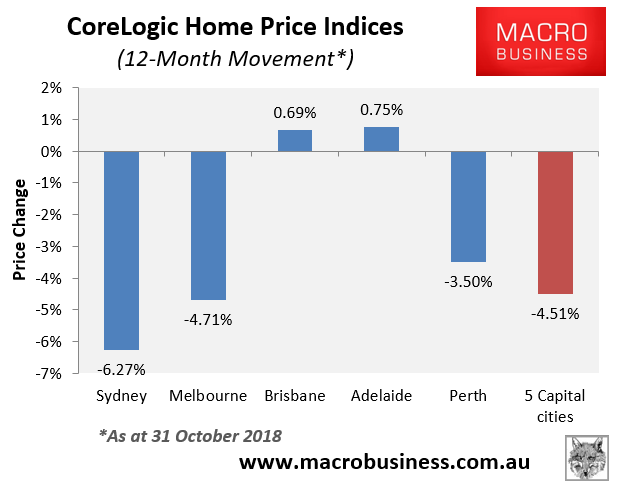
Please note that CoreLogic has revised its daily index, so the values differ from yesterday’s post. Here’s the annual price changes from the old series:
Advertisement
As you can see, Sydney’s annual price change has been revised down heavily, from -6.3% to -7.4%.
More broadly, CoreLogic reports that values across the combined capitals fell by 0.6% in October, driven by a large 0.7% respective decline in Sydney and Melbourne, and an 0.8% decline in Perth.
Advertisement
The combined regions, by comparison, only fell by 0.2% over October.
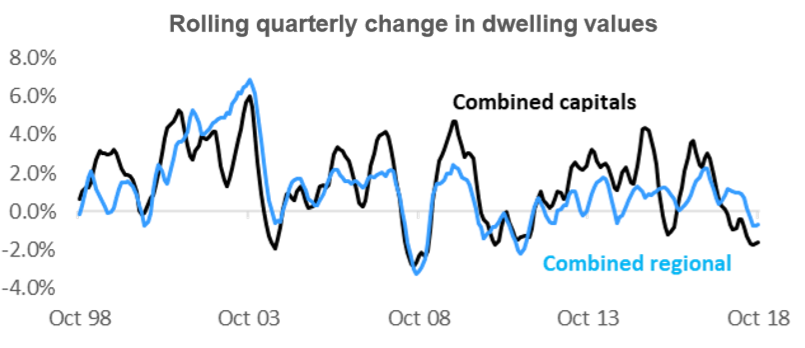
CoreLogic also shows that capital city quarterly growth (-1.6%) continues to run below regional growth (-0.7%):
Advertisement
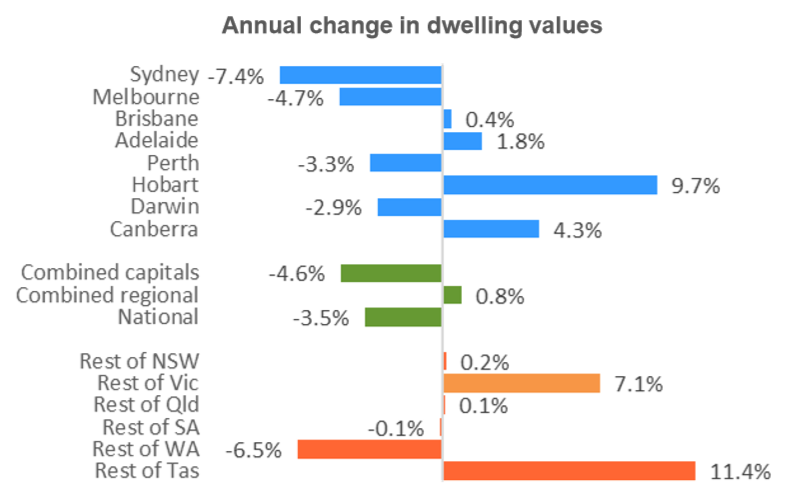
Whereas annual capital city growth (-4.6%) is also running well below regional growth (+0.8%):
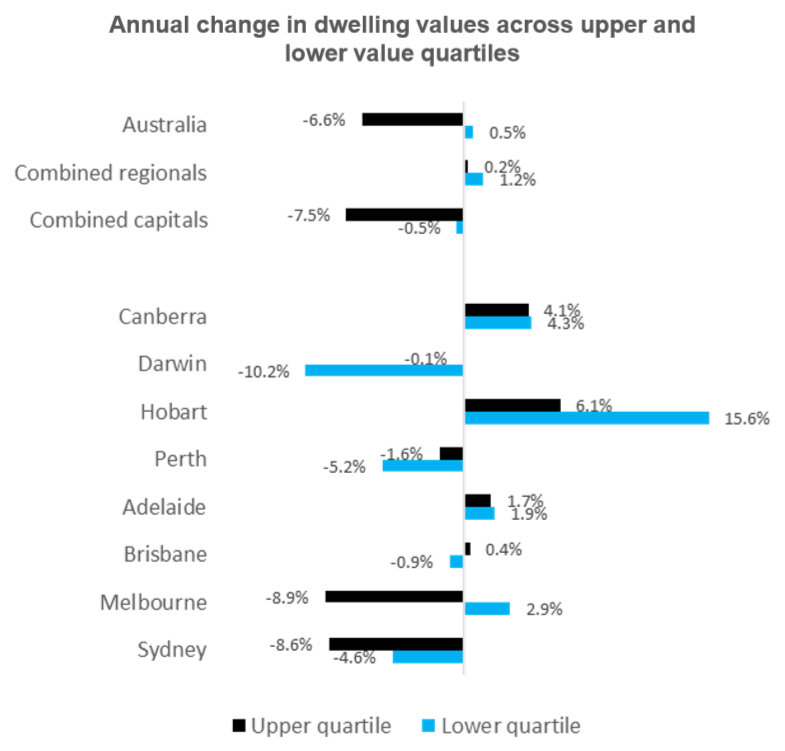
The below chart shows the declines by price segment, which shows the upper quartile driving the falls:
Advertisement
In its commentary, CoreLogic head of research, Tim Lawless, expects further price falls:
With credit availability remaining tight and rising inventory levels, we are expecting there will be further downwards pressure on housing values as we move through spring and into summer and the New Year.
Advertised stock levels are tracking 10.5% higher relative to the same time last year, with total listing numbers almost 20% higher across Sydney and Melbourne. With total listing numbers likely to push higher over the final quarter of the year, buyers are becoming more empowered and will increasingly find themselves in a stronger position when it comes to negotiating on price.
While stock levels are higher, transactional activity has reduced. CoreLogic estimates that year-on-year, settled sales activity is down 11.5%, leading to a slower rate of absorption through the spring listing season…
Although housing credit originations remain well below the formal APRA targets for investment lending and interest only lending, it’s clear that lenders are also focusing more on loan serviceability and reducing their exposure to borrowers with high debt levels relative to their incomes. These measures can help to explain the underperformance of more expensive housing markets where borrowers may find it more challenging to secure finance…
Advertisement
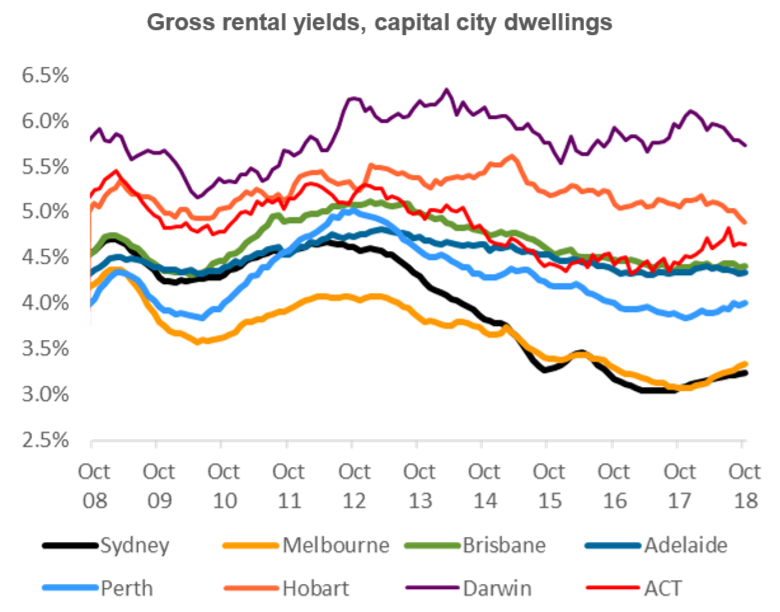
On the flipside, falling dwelling values has lifted rental yields from historical lows; albeit rental growth remains subdued:
Nationally, gross rental yields are picking up from previous record lows, rising from 3.71% in October last year to reach 3.87% in October 2018. Despite the subtle rise, gross rental yields remain well below their decade average of 4.31%.
A recovery in rental yields back to average levels is likely to take some time, considering national rents have remained relatively flat over the year to date and are only 0.8% higher over the past twelve months.
Rental yields reached record lows in late 2017 due to values consistently rising at a much faster pace than rents through the growth phase. Rental yields were compressed more significantly in Sydney and Melbourne, reaching record low readings of 3.04% and 3.07% respectively in 2017. These cities are still recording the lowest yield profiles at 3.24% and 3.34% at the end of October 2018.
Leith van Onselen is Chief Economist at the MB Fund and MB Super. He is also a co-founder of MacroBusiness.
Leith has previously worked at the Australian Treasury, Victorian Treasury and Goldman Sachs.