The Australian Population Research Institute (APRI) has released a new study entitled “Declining Economic Mobility in Australia – A report on households and people who have experienced income decline from 2011 to 2016”, which tracked the income of the same people over time, using the longitudinal Census data from the ABS, and found that:
There were more than 5.92 million people in Australia who were living in households where the household income had declined over the five years from 2011 to 2016; and
There were 3.34 million people who had a decline in personal income over the five-year period from 2011 to 2016 (approximately 20% of personal income earners in Australia).
Below are some key highlights from this report:
Advertisement
Australia has experienced more than a quarter of a century of aggregate economic growth, yet research into the mood of Australians has found low levels of optimism. The Committee for the Economic Development of Australia commissioned research in 2018 which found that:
Only 5% of Australians considered that they had benefited significantly from 26 years of continuous economic growth
31% of survey respondents were finding it difficult to live on their current income…
The report “Declining Economic Mobility in Australia – A report on households and people who have experienced income decline from 2011 to 2016” has found a missing piece of the puzzle that helps explain community sentiment…
To complete our study we drew on data from the Australian Census Longitudinal Dataset (ACLD). This dataset has 1.2 million linked data records covering the 2011 and the 2016 Census. We cross-tabulated personal income levels for the same individuals 5 years apart. The study identified that a very significant proportion of personal income earners had declining income over the period.
The analysis of changes in household income from the ACLD shows that there were more than 5.92 million people in Australia who were living in households where the household income had declined over the five years from 2011 to 2016.
Further, there were 3.34 million people who had a decline in personal income over the five-year period from 2011 to 2016.
The ACLD included detailed data on demographics and employment and the age and sex composition of the cohort who had experienced income decline was analysed.
… the story revealed in this study shows a different picture. It shows significant numbers of people and households that have seen their personal and household income decline over the most recent Census period. The high numbers of losers in the Australian economy may help to explain the mood of the Australian electorate, with high levels of uncertainty and anxiety about paying the bills now, and surviving into the future…
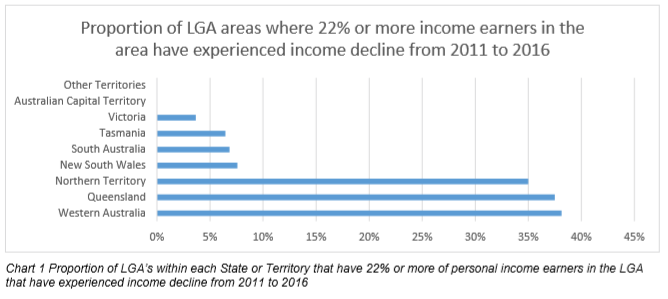
The LGA model shows that regions of Queensland, WA and the Northern Territory have been particularly affected by income decline. Chart 1 below shows the count of LGA areas in each State or Territory where the percentage of income earners who experienced income decline between 2011 and 2016 was 22% or higher…
DOWNWARD MOBILITY BY AGE AND SEX
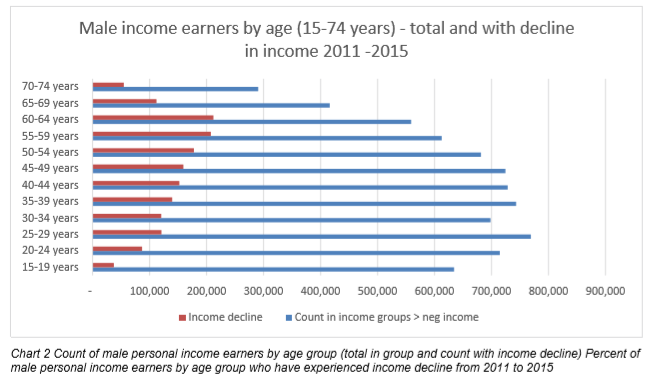
Chart 2 below show the proportion of male income earners in each age band who experienced a decline in income over the 5 year period. As the income earner age analysis is limited to 15-74 years, not all income earners are shown in these charts. The pattern of income decline for males shows an increase in overall numbers experiencing income decline in each successive age band from 30-34 years through to 60-64 years. It may be expected that retirement (including early retirement) may be a factor in declining income for those males aged 55 years or more.
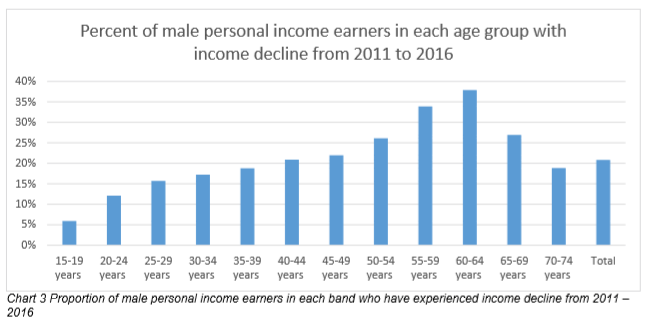
However, as chart 3 below shows, the overall proportion of males in the age groups from 15 to 74 years that have experienced income decline was 21%, and for all age bands from age 30-34 through to 70-74 years the minimum proportion with income decline in any age band was 17%. Therefore, it appears that factors other than life-stage events are contributing at a significant level to the observed patterns of income decline for males.
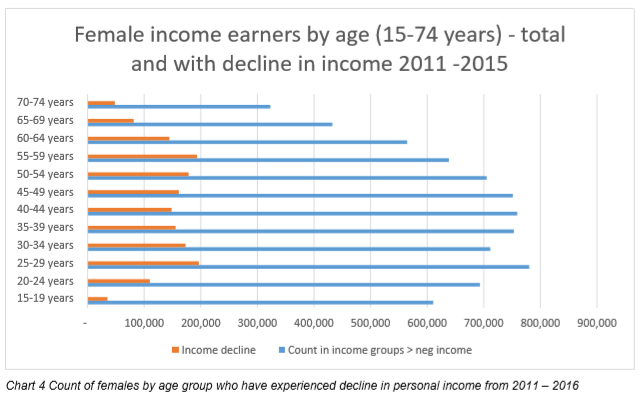
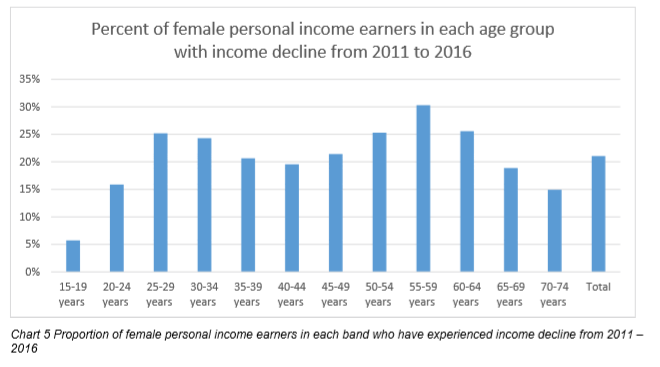
The pattern for decline in income for women is different to men. There is a peak in the 25-29 year age band, which would correspond with reduced participation in the labour force associated with starting a family, with a second peak in the 55-59 year age band.
Overall women have a similar proportion of personal income earners that have experienced a decline in personal income from 2011 – 2016 to the proportion of males with income decline (22%). For the age bands from 25-29 years through to the 60-64 year age band, no age group had less than 20% of personal income earners with decline in income.
DOWNWARD MOBILITY BY INDUSTRY OF EMPLOYMENT
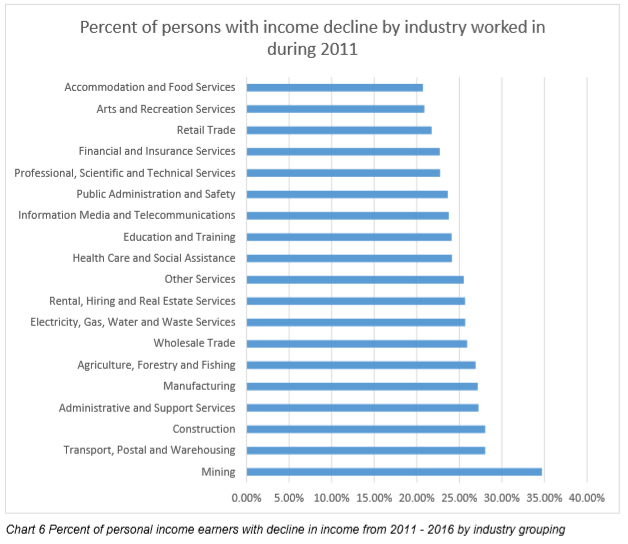
Chart 6 below shows the pattern of income decline by industry worked in during 2011. The industry experiencing the highest decline was mining, with almost 35% of people working in this industry experiencing a decline in income over the 5 year period. This data reflects the end of the mining boom and provides a partial explanation for the higher levels of declining income experienced by people in West Australia and Queensland over the period. However, the underlying pattern of income decline has applied across all industries, with no industry having less than 20% of people employed in the sector experiencing income decline over the 5 year period…
Leith van Onselen is Chief Economist at the MB Fund and MB Super. He is also a co-founder of MacroBusiness.
Leith has previously worked at the Australian Treasury, Victorian Treasury and Goldman Sachs.