By Gareth Aird, Senior Economist at CBA:
Key Points
- The RBA last cut the policy rate on 2 August 2016
- Since then, the labour market has tightened and inflation has lifted a little, but progress has been slow
- We have the RBA hiking the cash rate in Q4 2019
Overview
For RBA watchers it’s been a pretty dull past few years. The last move in the cash rate was August 2016. And the RBA has made it crystal clear that their period of
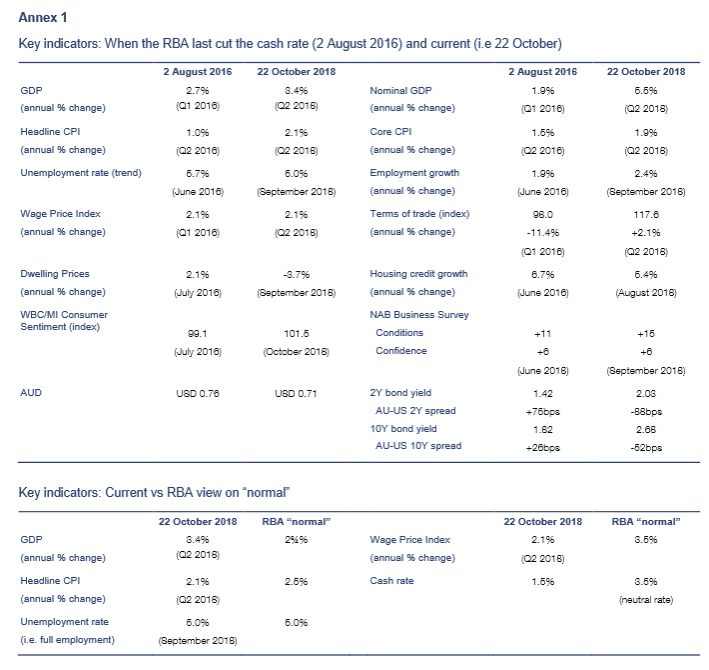
stability in interest rates will continue. Market pricing implies just a 50% chance of an interest rate hike over the next year. Put another way, the market is of the view that it’s an even – money chance that the RBA’s period of interest rate stability continues for another year (chart 1).
While the RBA’s policy rate hasn’t changed for more than two years, economic conditions have. In that context, we thought it would be a worthwhile exercise to look at how things compare today with 2 August 2016 when the policy rate was last cut. We cover the key inputs into the monetary policy debate. And have a look at how financial markets were tracking at the time. In our view, the evidence is clear that the economy has improved over that period. But progress has been slow, particularly given the global backdrop has been supportive. Annex 1 on page 4 summaries how key indicators on the economy have evolved.
The labour market
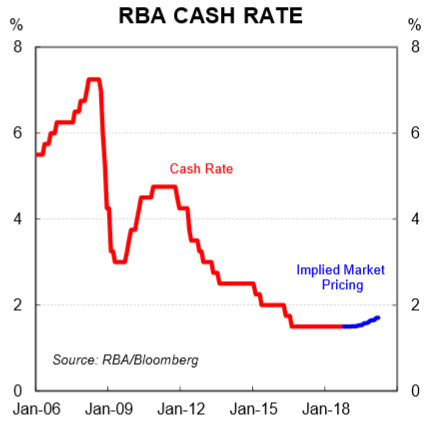
When the RBA last cut the cash rate the national unemployment rate was 5.7% (data for June 2016 had been published). Today it is 5.0% (chart 2). So the jobless rate has fallen by 0.7ppt since the RBA last eased policy. That’s clearly a move in the right direction. And it looks a lot better as a result of the September employment report which saw the unemployment rate fall by 0.3ppts over the month. According to the RBA’s estimate of the NAIRU, the September employment report implies that Australia is at full employment (note that earlier in the year we suggested that the NAIRU is likely to be lower than the RBA’s estimate of 5.0%). Indeed the RBA’s forecast profile has the unemployment rate at 5¼% right through to June 2020. So the latest result would have come as a surprise to them.
The broader measures of labour market slack have also declined a little since the RBA last cut the policy rate. Underutilisation, which is the sum of the unemployment rate and underemployment rate, was 14.3% in August 2016. Today it is 13.1%.
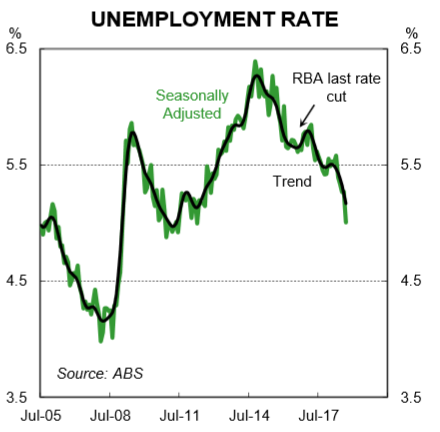
The number of people in paid employment has lifted significantly over the past few years. Employment growth was 1.9%pa when the RBA last cut the cash rate and was slowing. Today it is travelling at 2.3%pa. But those numbers only tell part of the story. For a lot of the past year employment growth has been around 3%pa (chart 3). A rise in participation reconciles the apparent disparity between the slow decline in the unemployment rate against the strong lift in headcount. The participation rate (trend) was 64.8% when the RBA cut in August 2016 while today it is 65.6%. And the employment to population ratio (trend) was 61.2% while today
it has risen to 62.2%.
The data confirms that the labour market has been gradually tightening since the RBA last eased policy. There is more work to be done, but the trends are consistent with our expectation that the next move in the cash rate is up.
Inflation
When the RBA last cut the cash rate in August 2016 it was shortly after the Q2 2016 CPI had been published which cemented the case for policy easing. The headline CPI had risen by 0.4% (following a shock 0.2% fall in Q3) and the annual rate stood at just 1.0%pa. Core inflation had lifted by 0.4% taking the annual rate to 1.5% (chart 4).
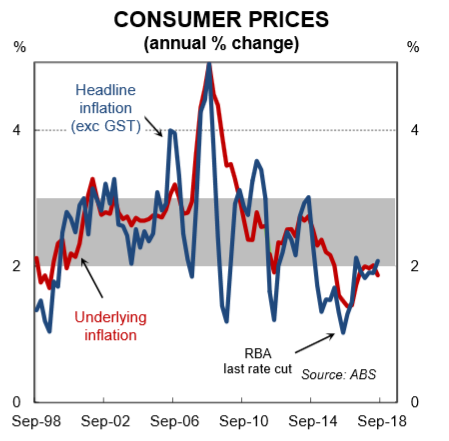
There were concerns a round disinflationary pressures persisting. Today, things look a little different. Headline inflation sits within the RBA’s target band at 2.1%pa (as at Q2 2018). And core inflation is 1.9%. The key message from the CPI is that inflation pressures remain contained. But we have seen the low point for the cycle which was back in 2016. For policy to be tightened, however, core inflation will need to pick up further from here and that will require a lift in wages growth. We see that happening.
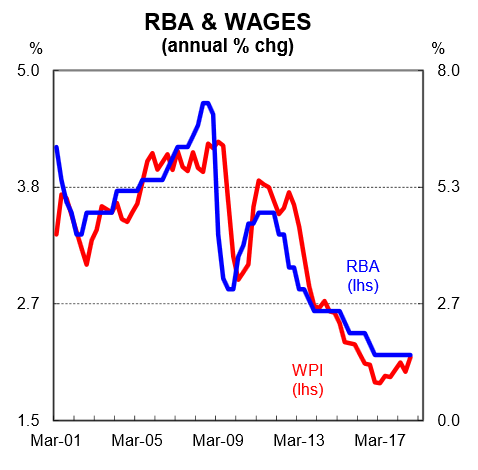
Wages
On the surface, the wages story doesn’t appear like it has changed a lot since the RBA eased policy. At the time of the August rate cut the RBA had wages data on
hand to Q1 2016. The Wage Price Index (WPI) had grown by 2.1% over the year. Today, the latest WPI (Q2 2018) puts growth also at 2.1% through the year. The detail,
however, is a little more illuminating.
First, wages growth, as measured by the WPI, hit a trough of 1.9% in Q3 2016 and has since accelerated a little. And second, the annual rate in the “WPI including bonuses” is running at 2.5% (chart 5).
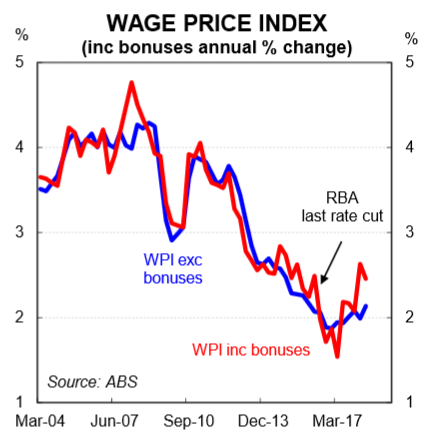
The data indicates that firms may be making greater use of discretionary payments like bonuses to lift the pay packets of workers. Indeed, this is consistent with recent comments out of the RBA, some of the business surveys and also our own liaison. We expect to see wages growth continue to lift over the next year as the labour market tightens further.
GDP
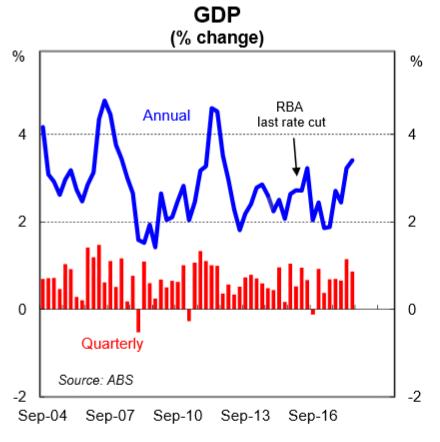
As at August 2016, the ABS had only published GDP data to Q1 2016. So the GDP figures the RBA had on hand when they cut the cash rate were dated. They showed real
GDP growth was running at a trend – like 2.7%pa. That looked ok. But what the central bank didn’t know was that it would be subsequently recorded that the economy contracted over Q3 2016 (i.e. the quarter that they last eased policy). Fast forward to the present day and the latest output data on the economy was strong. GDP growth was running at an above – trend pace of 3.4%pa at Q2 2018 (chart 6). And within that, business investment sat 10.2% higher through the year. We expect above- trend growth to continue over the next two years and for the annual rate of growth to have a 3-handle on it over that period.
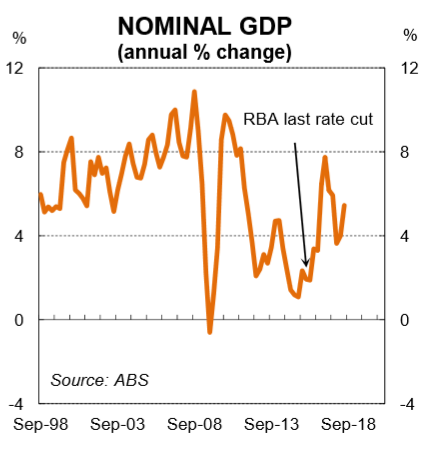
Nominal GDP, the broadest measure of national income, sat just 1.9% higher through the year at Q1 2016 (the most up to date data the RBA had when they cut the cash rate in August 2016). But thanks to a solid lift in the terms-of-trade, it has been much stronger over the past two years. Indeed, the lift in nominal GDP goes a long way to explaining the improvement in the Commonwealth Budget bottom line over that period. The latest data on nominal GDP shows it was running at 5.5%pa at Q2 2018 (chart 7).
Housing market
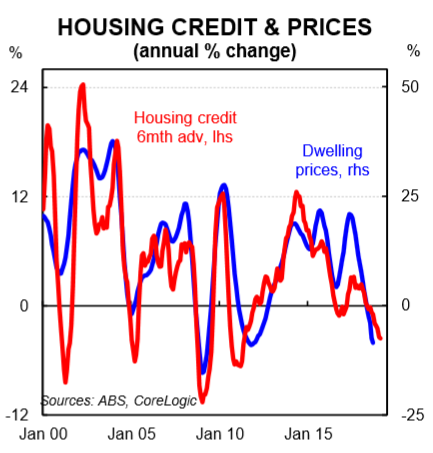
The housing market is the one area where from a monetary policy perspective things have evolved in a way that is more commensurate with the next move in the cash rate being down rather than up. National dwelling prices, led by Sydney and Melbourne, have fallen over the past year (chart 8). And credit growth has eased because the flow of new lending to investors has fallen.
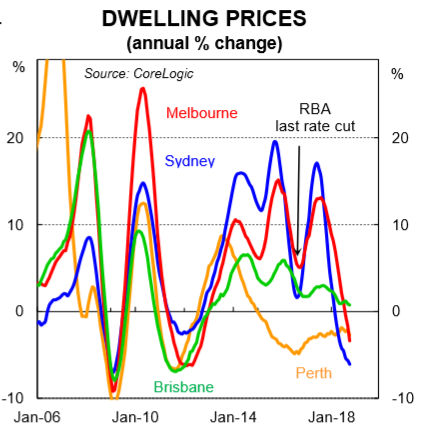
Looking back to August 2016 from a housing market perspective indicates the RBA misread the situation. At the time of the August rate cut, national dwelling price growth had slowed to just 2.0%pa. In the accompanying Statement to the monetary policy decision, then RBA Governor Glenn Stevens said, “this [i.e. a slowdown in credit growth and lift in dwelling supply] suggests that the likelihood of lower interest rates exacerbating risks in the housing market has diminished”. Over the subsequent year (i.e. following the rate cut in August) dwelling price growth accelerated to be 10.7%pa by July 2017. Looking back, it is clear that the RBA’s two rate cuts in 2016 reignited the housing market.
Today, however, things look very different. The latest CoreLogic data for September puts dwelling prices down by 4.1%pa for the 8 capital cities. And we think that further dwelling price deflation is likely given softer credit growth (chart 9), less foreign demand and more rational price expectations from would-be buyers, especially investors.
The housing market remains the key domestic risk for the Australian economy. As yet there is no evidence of a negative wealth effect – that is, falling dwelling prices weighing on the spending decisions of households. But if price falls were to accelerate there is a risk that there is a negative spill-over to consumer spending and employment growth. That is not in our central scenario for the economy but it is a key downside risk to the outlook.
Bond market
When the RBA last cut the policy rate the Australian 2Y government bond yield was 1.43%. Indeed, the Overnight Index Swap (OIS) market was pricing in an 86% chance that that the cash rate would be taken down to 1.25%. The spread between the Aussie and US 2Y bond yields was +75bps. Today, that picture looks very different.
The Aussie 2Y bond yield is currently trading at a little over 2.0% (chart 10). And the market is pricing in an even money chance that the RBA hikes over the next year
which is why the 2Y rate is higher than the cash rate.
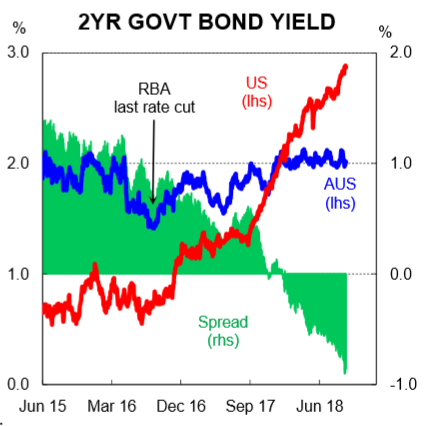
Perhaps more significantly, the spread between the Aussie and US 2Y bond yield has inverted to now be around – 88 bps. The move is explained by the strong upward trend in US bond yields. The US Federal Reserve has been tightening policy, and is expected to continue to do so until the Fed funds rate hits 3%. The move in interest rate differentials has had implications for the Aussie dollar.
Exchange rate
When the RBA cut the cash rate in August 2016 the AUD was buying USD0.76. Today, despite the terms-of-trade sitting higher and the market pricing in a rate hike rather than a cut, the AUD is worth USD0.71 (chart 11). The fall in the AUD looks unusual on the surface because things have improved in Australia. But currencies are a relative game. The improvement in the US economy and lift in inflation and bond yields has been far more pronounced than the progress made in Australia and many other regions. That has contributed to USD strength and therefore a softer Aussie dollar.
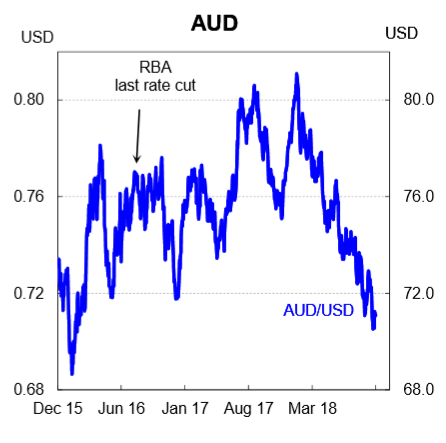
From an RBA perspective, the fall in the exchange rate has been a positive development. The currency has depreciated without an associated fall in commodity prices. And the lower AUD, while boosting export receipts, gives the RBA greater comfort its above-trend GDP forecasts will be realised while also putting some upward pressure on inflation which the Bank desires given inflation remains below the midpoint of their 2-3% target band.
Conclusion and implications
On balance, conditions in the Australian economy have improved since the RBA last cut the cash rate. Compared with August 2016, the unemployment rate is today lower and growth, income and inflation are all higher. The Budget balance has also improved and the Australian dollar is lower now which is supporting our external sector at a time when commodity prices are buoyant.
We expect most of these themes to continue to be in play over the next year. More specifically, we expect that the labour market will continue to tighten, in line
with the leading indicators of employment. And in our view that should put some upward pressure on wages which should drag core inflation higher. As such, we
think that the RBA will lift the cash rate in Q4 2019. Trends in the housing market, however, will bear close watching.