
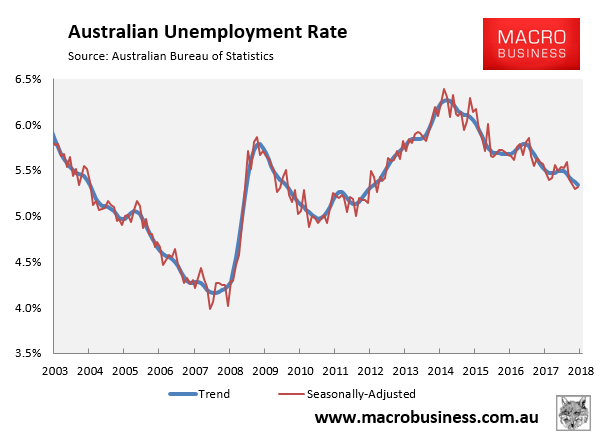
As summarised earlier, the Australian Bureau of Statistics (ABS) today released its labour force report for August, which registered a strong 44,000 increase in total employment but no change in the headline unemployment rate (still 5.3%) because of rising labour force participation.
In trend terms, the unemployment rate fell marginally from 5.37% to 5.34%:
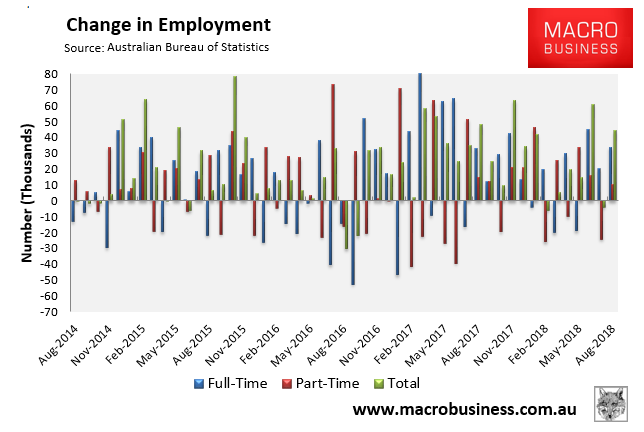
Again, total employment rose by a seasonally adjusted 44,000 to 12,631,300. Full-time jobs increased by 33,700, whereas part-time employment increased by 10,200:
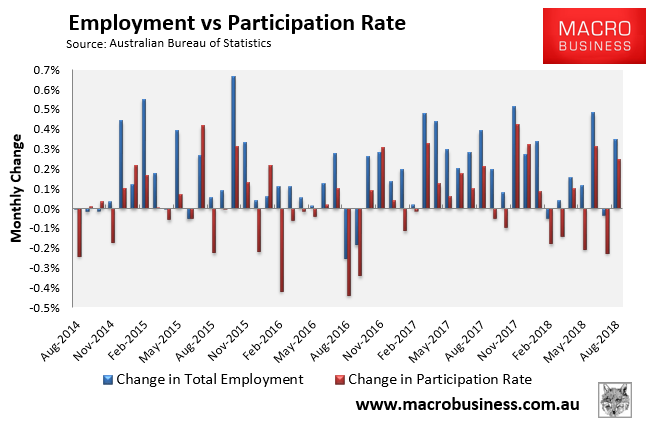
The participation rate rose by 0.16% to 65.71%, which is the main reason why the unemployment rate was steady despite rising jobs:
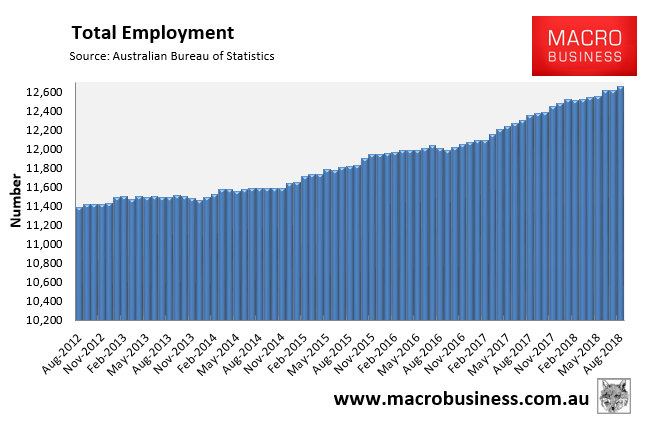
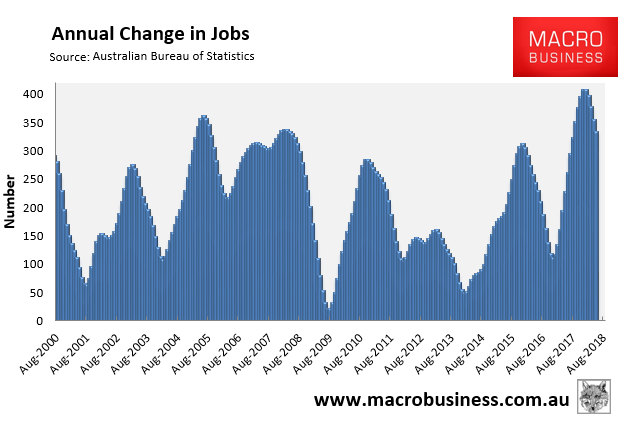
Total employment continues to trend higher, although actual annual jobs growth is falling:
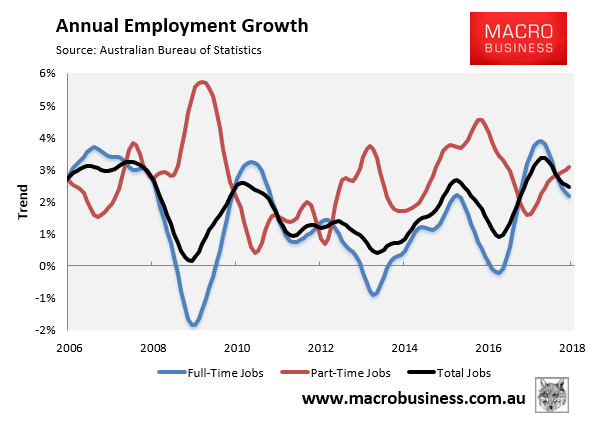
The trend annual growth rate has faded to (+2.5%) on the back of weakening full-time employment growth (+2.2%), whereas part-time employment growth is rising (+3.1%):
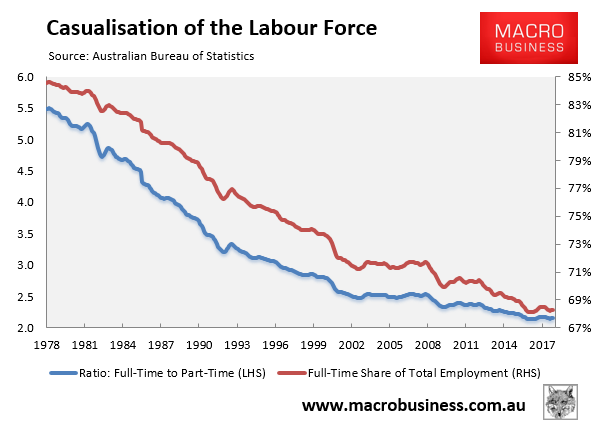
The proportion of the population in full-time work has stabilised:
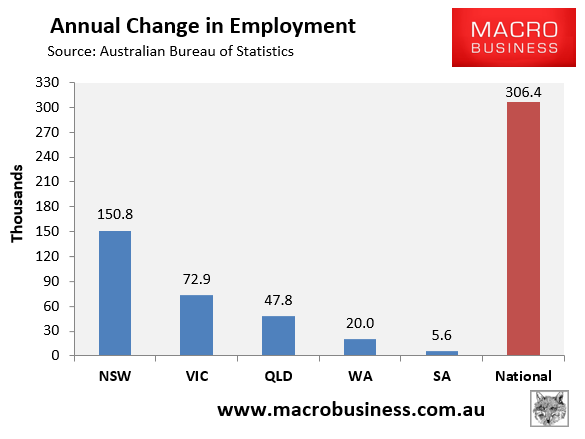
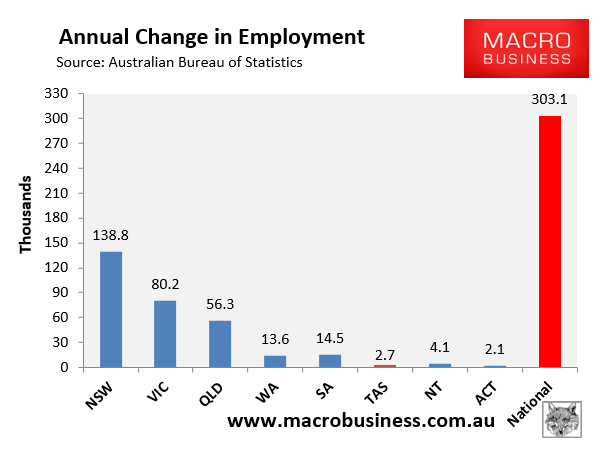
In August, NSW easily led jobs growth over the past year in seasonally-adjusted terms:
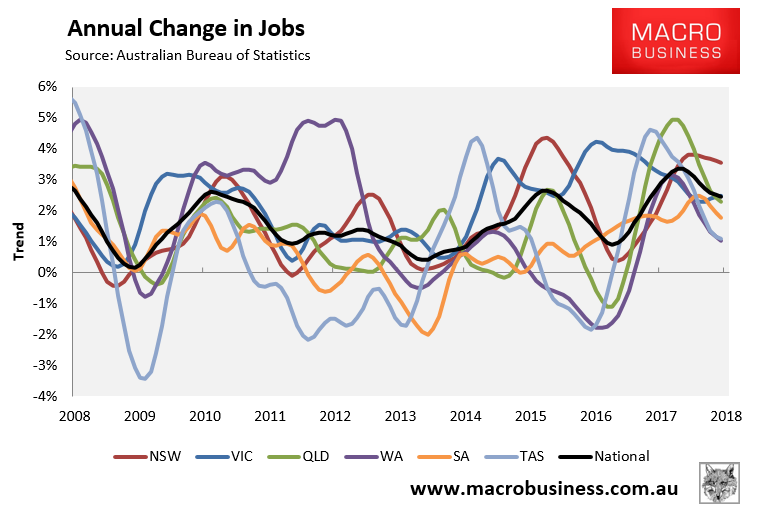
The state seasonally-adjusted figures are notoriously volatile and subject to a big margin of error. As such, the below chart tracks state jobs growth in trend terms. Here, the three major jurisdictions have driven the jobs growth:
All states are now experiencing annual jobs growth in trend terms, although growth is fading across all jurisdictions:
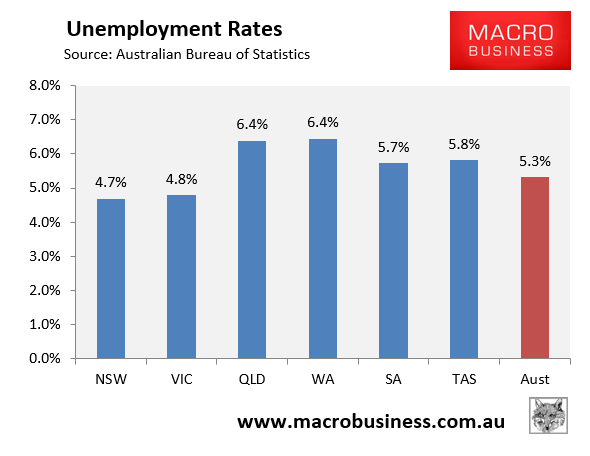
QLD and WA now have the highest seasonally adjusted unemployment and NSW and VIC the lowest:
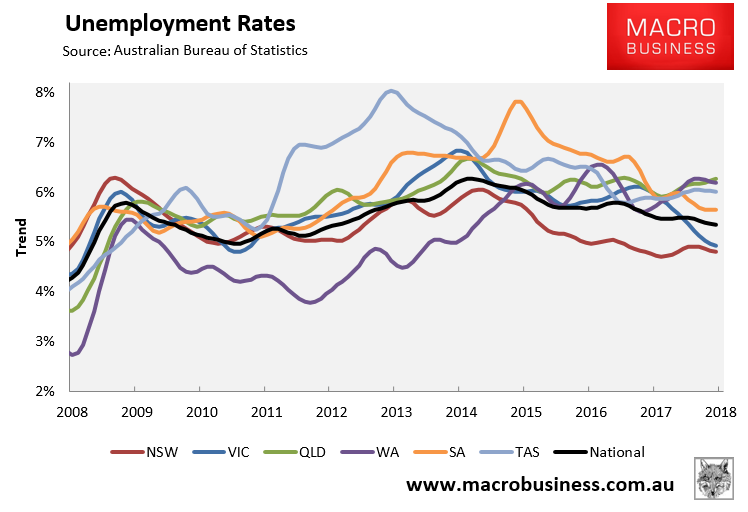
However, the below chart shows the ABS’ more reliable trend unemployment rates, which shows NSW and VIC with the lowest unemployment and WA, QLD and TAS with the highest:
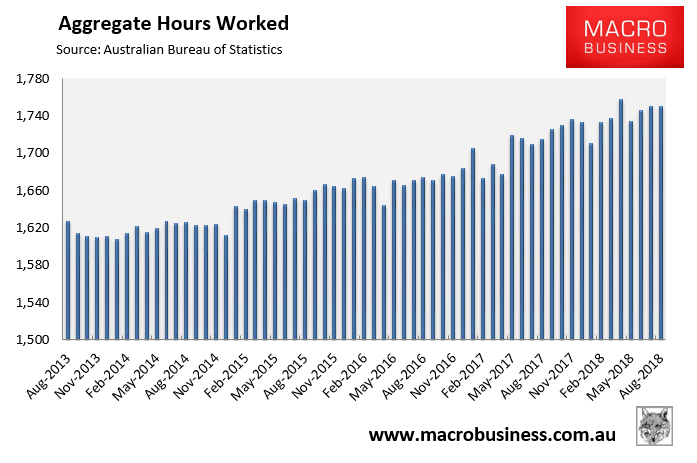
The aggregate number of hours worked has failed to recover May’s heavy fall. It rose only 0.6 million hours (0.03%) in August, with total hours worked rising by 2.1% over the past year:
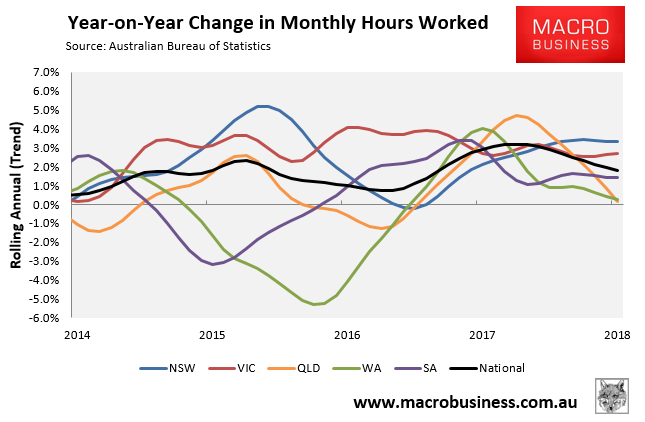
The below chart, which tracks the annual change in hours worked on a trend basis, paints a mixed picture, with differing growth across jurisdictions but 1.8% growth recorded nationally, with a falling trend:
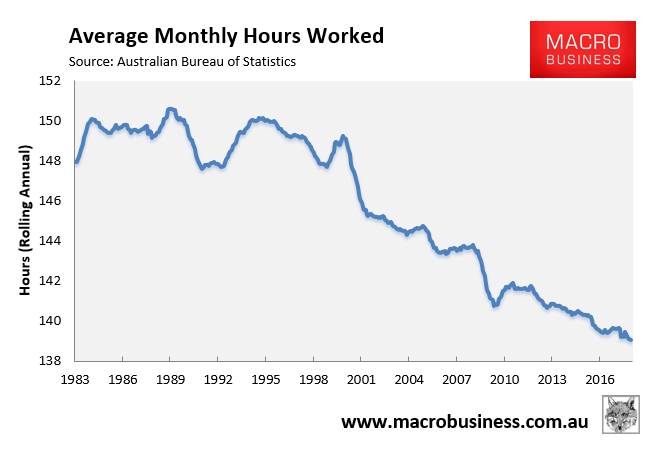
Average hours worked is also stuck near all-time lows:
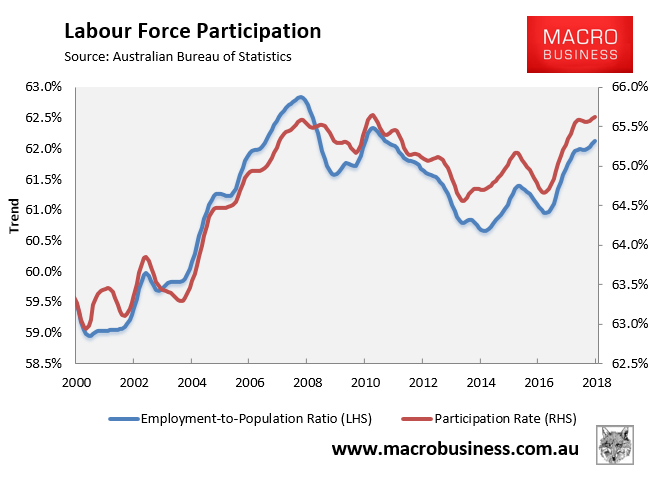
However, workforce participation is tracking near all-time highs:
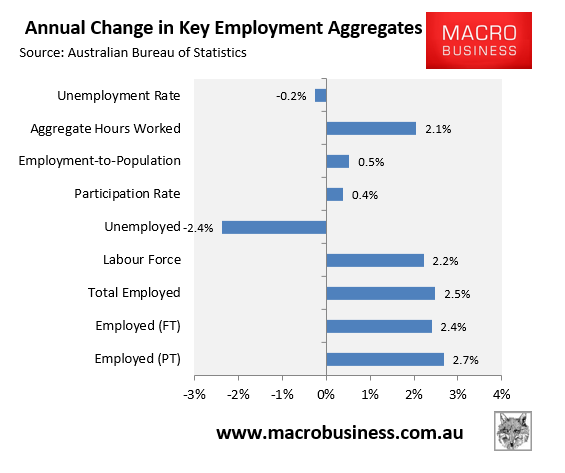
The next chart summarises the annual change in the key employment aggregates on a seasonally-adjusted basis, which shows a broadly recovered labour market:
Finally, both underemployment and underutilisation continue to slowly improve on a national level, but with huge divergence across jurisdictions:
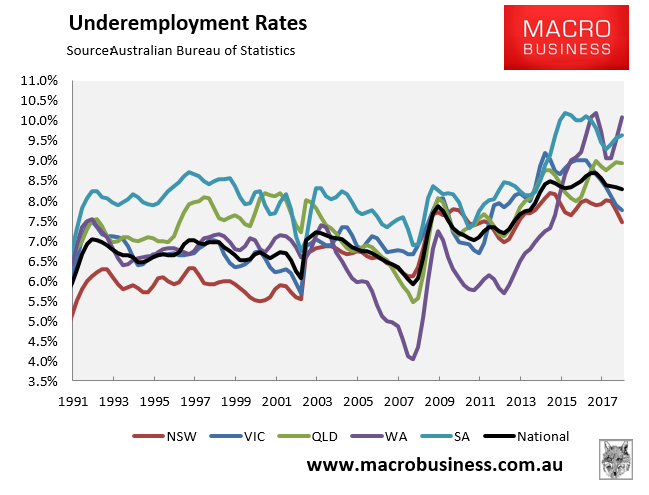
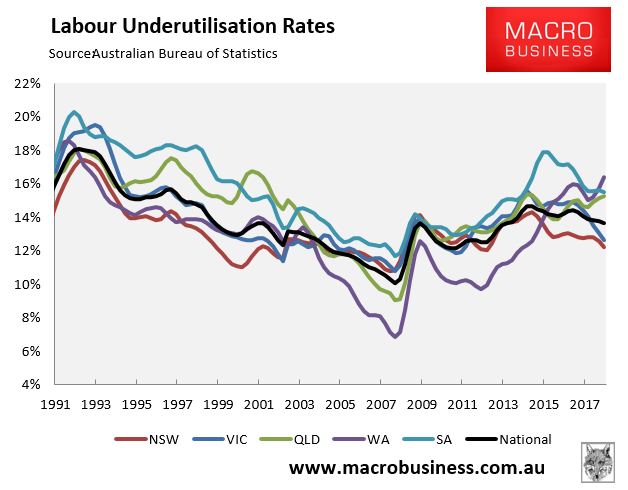
The national underemployment rate fell marginally (-0.05%) to 8.3% in the August quarter in trend terms, whereas the underutilsation rate fell by 0.1% to 13.6%.
In summary, after a good year-and-a-half of employment data, the labour market has softened a little, given:
- Falling trend hours worked;
- Falling trend jobs growth;
- Falling trend full-time jobs growth; and
- Still elevated underemployment.
Despite the marked improvement, significant labour market slack remains, which means wages growth will likely remain subdued.
