Stronger growth in export receipts has taken Australia’s trade balance into the black.
But the current account remains in deficit because the net income deficit has widened.
We expect Australia’s current account deficit to average 2½% of GDP over the next two years – lower than the 30‑year average of 4¼%.
Overview
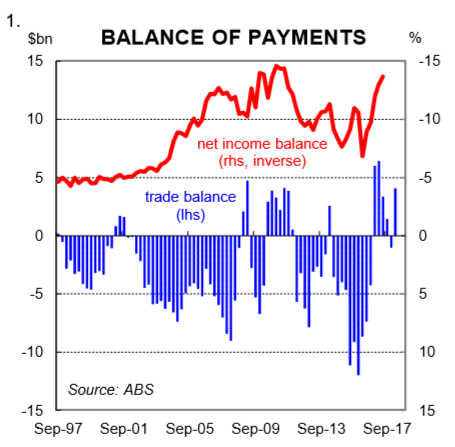
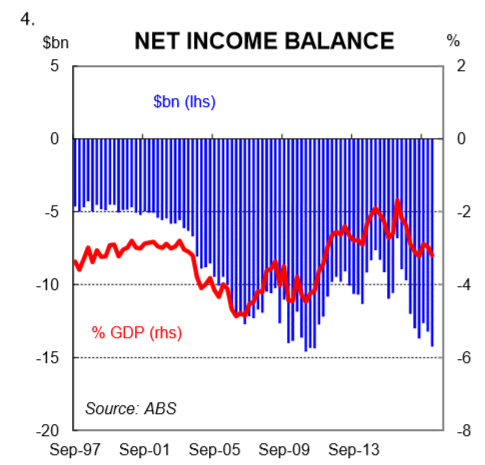
Australia’s trade balance has improved significantly over the past 1½ years. After being in deficit for most of the period from 2012 to late‑2016, the balance on goods and services has been in surplus for five of the past six quarters (chart 1). Another surplus will be posted in Q2 2018 based on the monthly trade data. But despite this, Australia remains a net borrower from the rest of the world (chart 2). That is, we continue to run a current account deficit because the net income deficit is bigger than the trade surplus. We expect that will continue to be the case over the next few years. This note explores why.
The current account explained
The current account balance is simply the difference between national savings and investment. Australia has typically run current account deficits because investment has been higher than savings. In fact, the last time Australia posted a current account surplus was back in 1975. Current account deficits need to be funded and they lead to an accumulation of debt over time. Australia’s debt burden to the rest of the world has increased our exposure to movements in global financial markets.
By running a current account deficit Australia has been able to sustain a higher rate of investment than otherwise. And it has meant that GDP growth, living standards and interest rates have also been higher than otherwise.
The ABS publishes an update on the current account on a quarterly basis. It is broken down into two parts; (i) the trade balance; and (ii) the net income balance.
The trade balance
The trade balance, which is the balance on goods and services, is a pretty easy one to conceptualise. It is simply the calculation of a country’s exports minus its imports. Australia has had a significant turnaround in its trade balance since late‑2016. We are now posting some pretty healthy surpluses primarily due to (i) a lift in resource export volumes; and (ii) firmer commodity prices because of a buoyant global economy and some supply‑side cuts due to environmental restrictions in China.
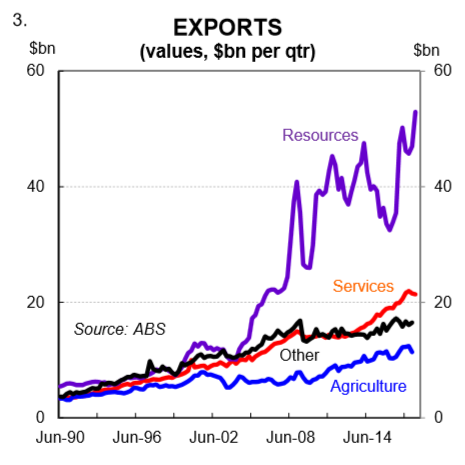
Export receipts have risen significantly over the past 1½ years. In Q3 2016 Australia’s exports totalled $83bn. In Q1 2018 (latest available) exports had risen by 24% to $103bn. Within that, hard commodity exports have risen by a whopping 50% to $53bn (chart 3). Strong growth in export receipts, thanks to higher commodity prices, have supported Government revenue (both through the tax intake and through royalties). As a result, the Budget bottom line has improved.
The net income deficit
The other component of the current account is the net income balance. It is an account of the returns on foreign holdings of Australian assets against Australian holdings of foreign assets. This may take the form of interest, dividends or reinvested earnings.
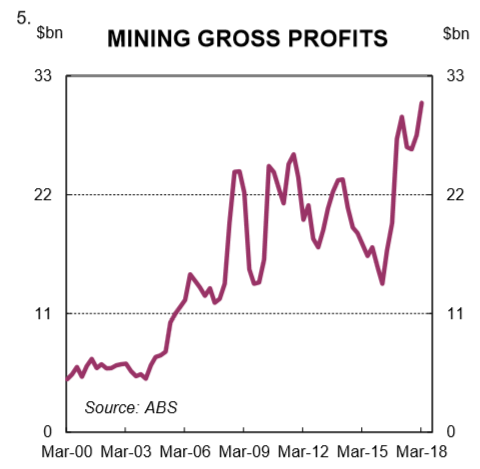
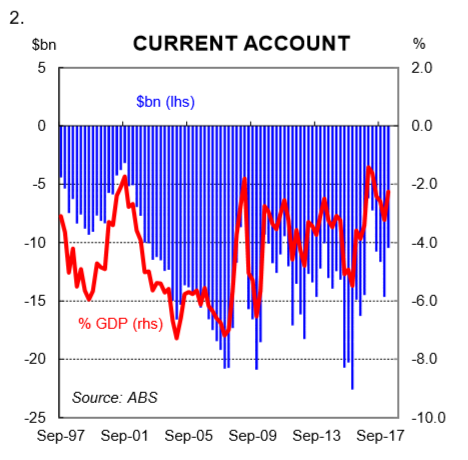
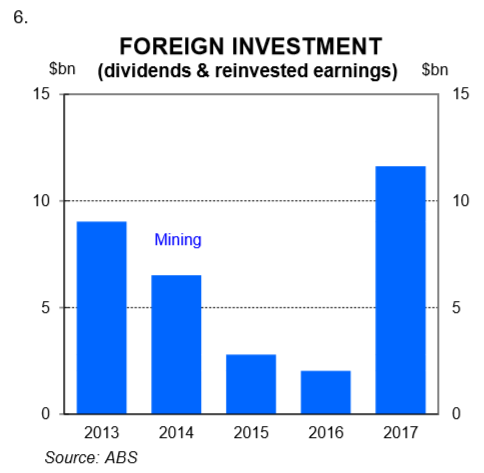
Over the past two years, Australia’s net income deficit has risen, both in absolute terms and also as a share of GDP (chart 4). A good reason for this is the lift in resource export receipts that have greatly improved profit growth in the resources sector (chart 5). From a balance of payments perspective, the lift in profitability of the mining sector has meant an increase in payments to foreign owners. This has taken the form of dividend payments and also reinvested earnings. Data published by the ABS shows that mining dividend payments and reinvested earnings that accrued to foreign owners rose by $9.5bn in 2017 (chart 6).
Effectively there has been a circularity at work over the past two years with respect to the improvement in the trade balance and the widening in the net income deficit.
Higher resource export receipts, which have pushed up profits in the resources sector, have propelled the trade balance into surplus. But a decent share of those profits have flowed out of Australia which has resulted in a widening of the net income deficit. The net result has been a reduction in the size of the current account deficit a share of GDP. But the decline has not been by as much as the improvement in the trade balance alone would have implied.
It is worth noting that the RBA estimates that 40‑50cents of each dollar of resources revenue “leaks” offshore. By definition, that means that the remaining 50‑60cents of income stays in Australia.
Net foreign liabilities
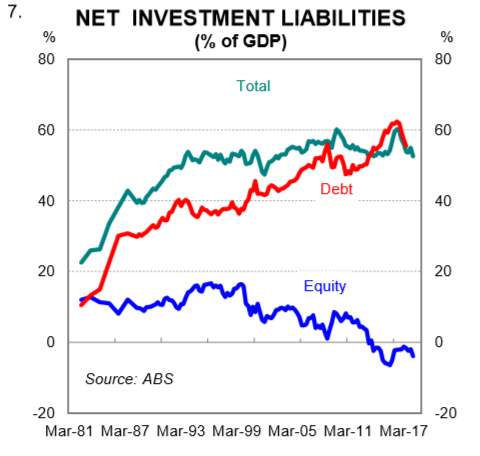
The cumulative impact of running current account deficits is expressed in our net international investment position. As at Q1 2018, Australia had a net liability with the rest of the world a little shy of $1 trillion. Net foreign debt sits at a touch over $1 trillion while the net equity position is in positive territory (i.e. we hold more in the way of foreign equity than the level of foreign investment in Australian equity).
Net foreign liabilities tend to be expressed as a share of GDP. That is, the debt burden is expressed as a share of the economy (chart 7). Australia’s net foreign liabilities currently stand at 53% of GDP. They have come down from a peak of 60% in Q2 2016. The improvement reflects both a decline in net foreign debt as a share of GDP and an increase in net equity.
On the equity side, the value of Australia’s foreign equity has increased over the past few years by more than the value of foreign investment in Australia (as an example, the S&P 500 has significantly outperformed the ASX 200). On the debt side, the level of net foreign debt has remained broadly stable. But as the economy has continued to grow over the past few years (indeed nominal GDP growth, which is the denominator, has been quite good) the ratio of debt to GDP has fallen.
Could Australia post a current account surplus?
Australia’s current account deficit has narrowed from 4.7% of GDP in 2015 to 2.5% of GDP in 2017 (as at Q1 2018 it was 2.3% of GDP). Over that period, the balance on goods and services has swung around to a trade surplus. But that has been partially offset by an increase in the net income deficit.
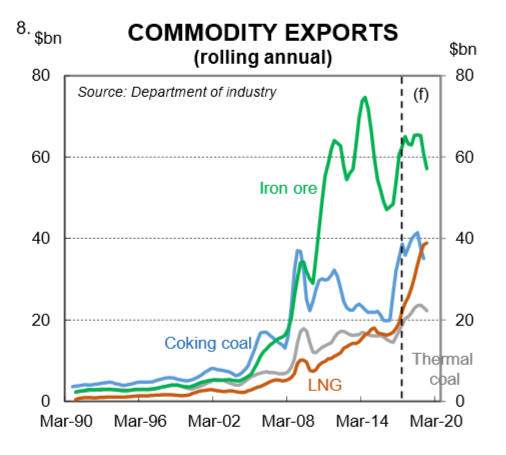
Our expectation is that Australia’s trade balance, on average, will be in surplus over the next few years. While we expect commodities prices to come off a little, there is a significant ramp up of LNG exports to come which will support export receipts (chart 8). But unfortunately a lot of that export revenue will find its way back offshore given LNG projects in Australia are majority foreign owned. As such, we expect the net income deficit to widen a little bit further as commodity export receipts grow.
On our numbers, that would see the current account deficit average around 2½% of GDP throughout that period.
A move to a current account surplus would likely require bigger trade surpluses than we have forecast as well as a narrowing in the net income deficit. It’s possible, but we don’t think that will happen over the near term unless there is a significant downturn in the economy. And that is not our central scenario.
Ultimately, the only way that we could envisage Australia posting a current account surplus over the next two years is via a collapse in imports. And the only way we see that happening is if domestic demand falls sharply and unemployment rises – neither outcome is desirable.
Over the medium to longer term Australia’s net equity position should continue to improve given the growth in assets held by Australian superannuation funds. But that alone is unlikely to deliver a current account surplus. Higher hard commodity prices would also likely be required. That of course is possible. But we think that it’s more likely that the basket of hard commodity prices will drift lower over the next five years.
What does it mean for interest rates?
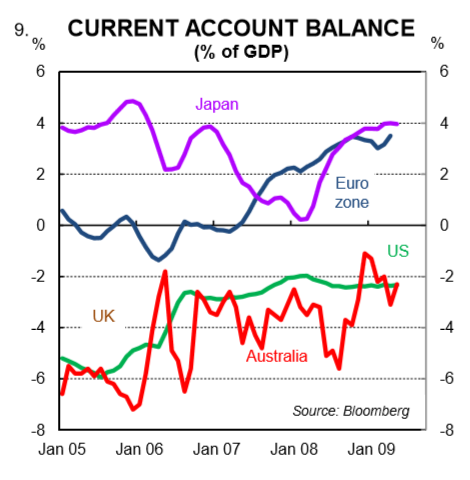
We believe that in Australia’s case, running a current account deficit means that the lower bound for the RBA’s policy rate is around 0.75%‑1.0%. This is higher than the lower bound of many other advanced economies. In the Eurozone and Japan, for example, policy rates have gone negative. But these regions run current account surpluses which gives them greater scope to take rates down (chart 9). In Australia, it is probably not possible to cut the cash rate below 0.75%‑1% without causing a big fall in the AUD because the current account deficit must be funded.
Indeed back in 2012, Dr Philip Lowe (then Deputy Governor of the RBA) stated that, in Australia’s case, the “threshold level” of the policy rate would be “somewhere around 1%, plus or minus a bit”. Now Dr Lowe may have since changed his view given that the cash rate at the time was significantly higher than where it is currently at 1.5%. But it does suggest that he is of the view that the lower bound in Australia is not as low as it is in some other regions.
Our view on the outlook for the cash rate is that the next move is up and not down. But from where we currently stand, and given we continue to run a current account deficit in Australia, we think that the RBA probably only has about 3 rate cut bullets left. As such, we believe that the Governor will look to normalise interest rates if the opportunity presents itself in part because it affords the RBA with more capacity to provide policy accommodation in the event of a future shock.