The big economic news over the weekend was the US July non-farm payrolls, which came in at 157,000 versus 193,000 expected. However, the previously two months were revised up by a combined 59,000 jobs, whereas the US unemployment rate declined to 3.9% and the broader U-6 unemployment declined to 7.5%. Wages growth was also close to expectations, but a little on the soft side. From the BLS:
Total nonfarm payroll employment rose by 157,000 in July, and the unemployment rate edged down to 3.9 percent, the U.S. Bureau of Labor Statistics reported today. Employment increased in professional and business services, in manufacturing, and in health care and social assistance.
…
The change in total nonfarm payroll employment for May was revised up from +244,000 to +268,000, and the change for June was revised up from +213,000 to +248,000. With these revisions, employment gains in May and June combined were 59,000 more than previously reported.
…
In July, average hourly earnings for all employees on private nonfarm payrolls rose by 7 cents to $27.05. Over the year, average hourly earnings have increased by 71 cents, or 2.7 percent.
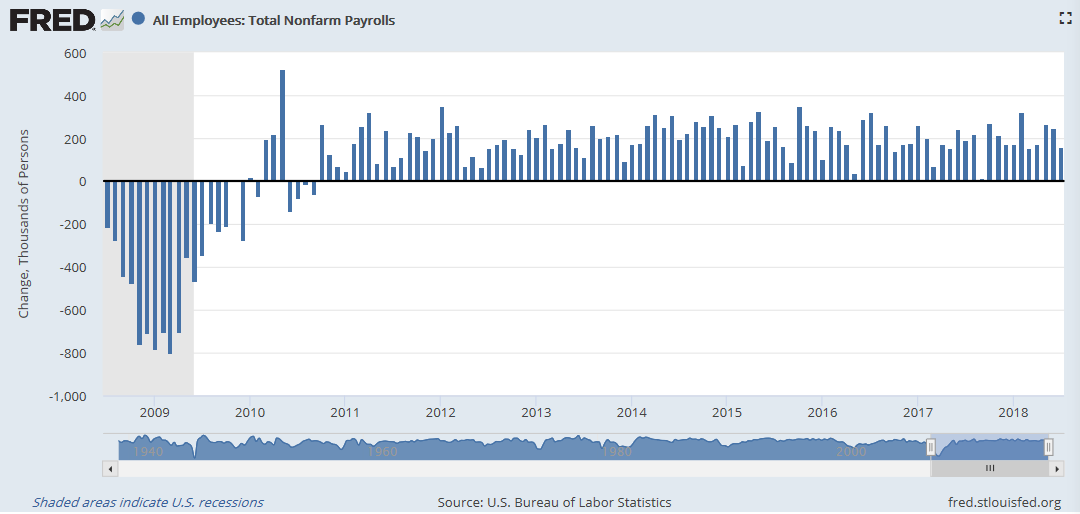
The below charts tell the story on the US labour market.
First, monthly payrolls:
Advertisement
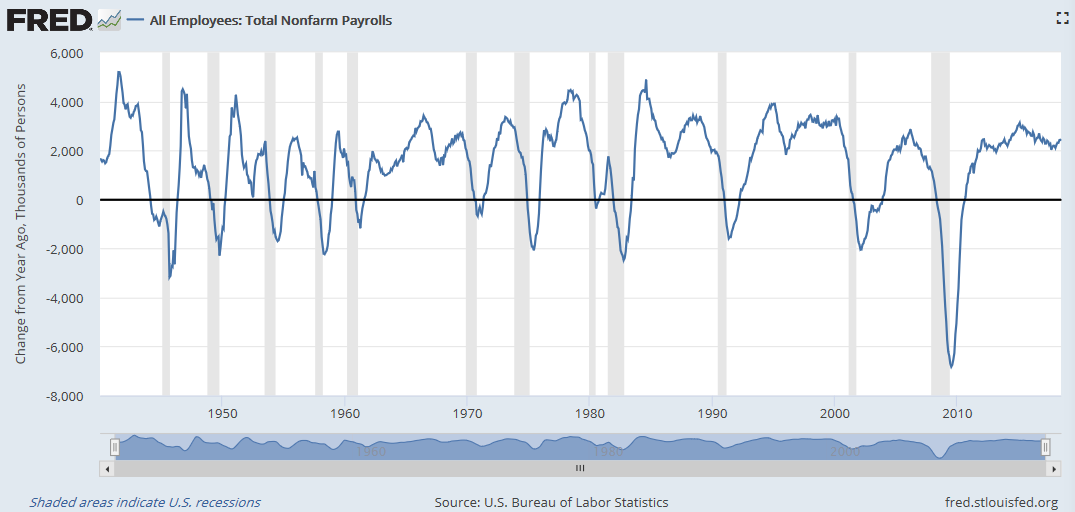
Next, the year-over-year change in total non-farm employment:
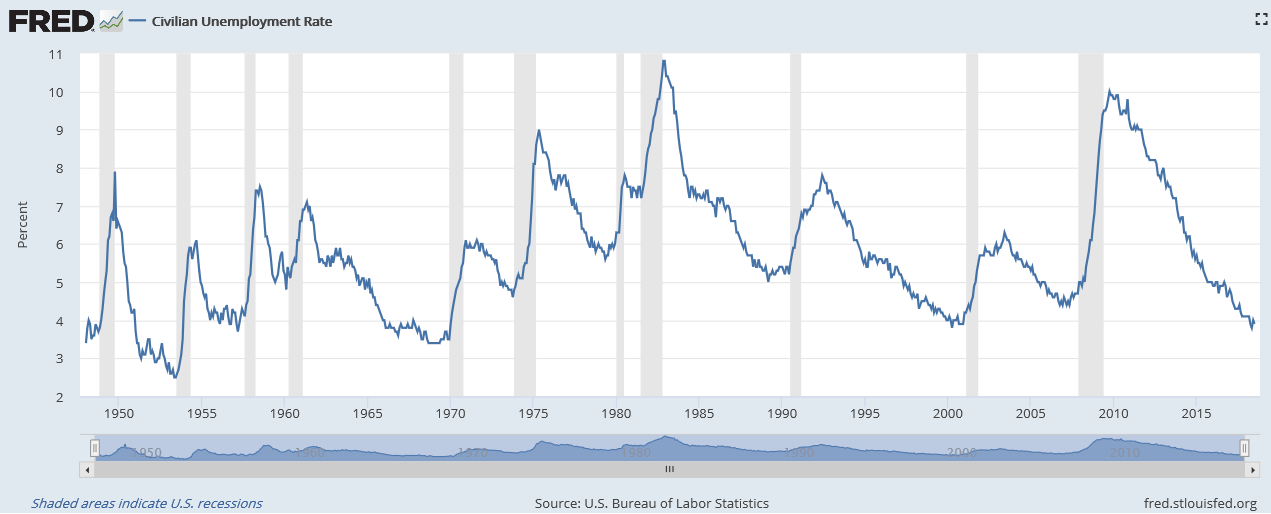
Next, the civilian unemployment rate:
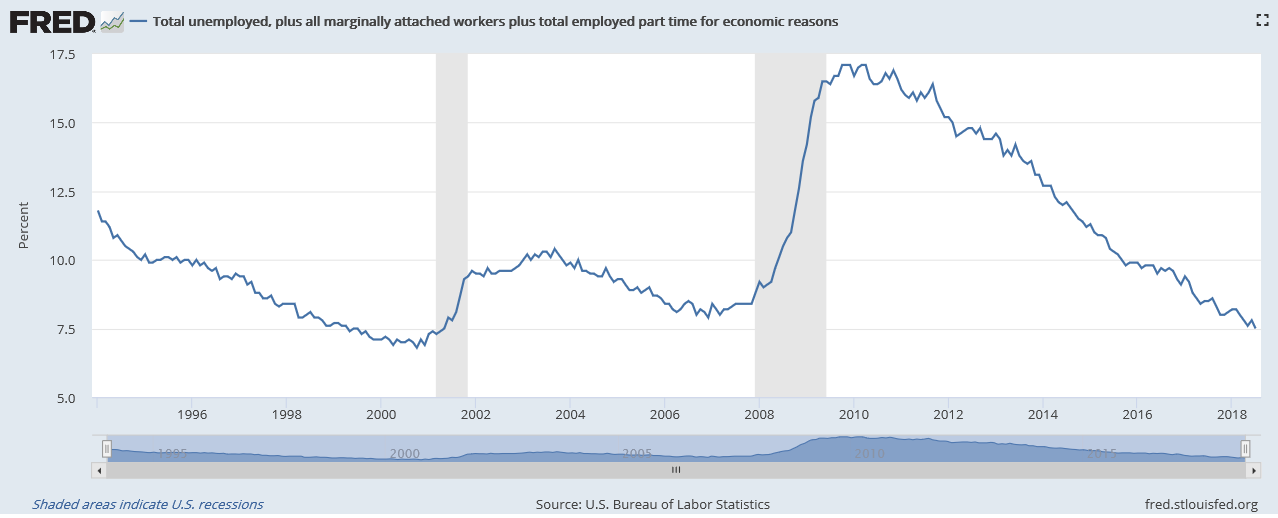
And finally, so-called U-6 unemployment, which measures “total unemployed, plus all marginally attached workers plus total employed part time for economic reasons”:
Advertisement
Overall, non-farm payrolls was close to estimates but viewed by the market as being on the soft side, with wages data also revised down.
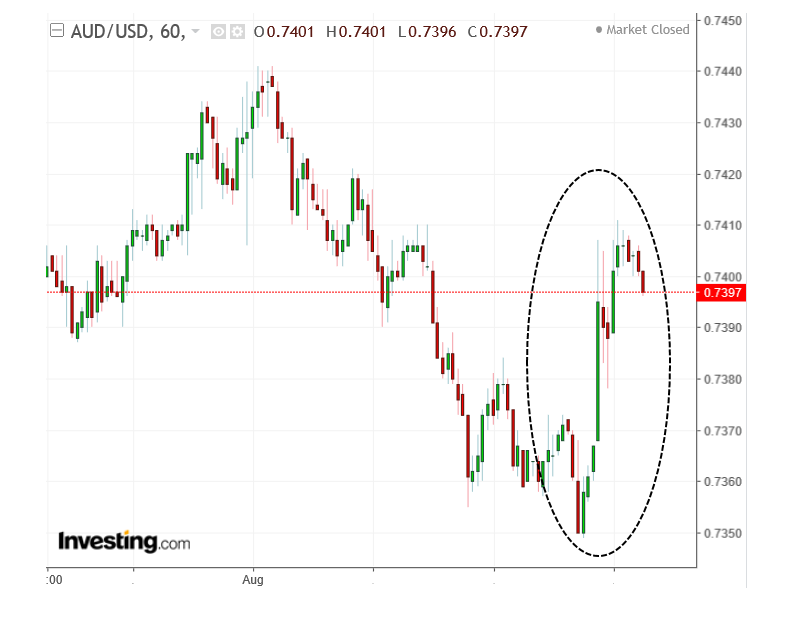
The weaker than expected employment report triggered a fall in the US dollar against major currencies, with the AUD a key beneficiary, rallying to around $0.74 from $0.736:
Advertisement
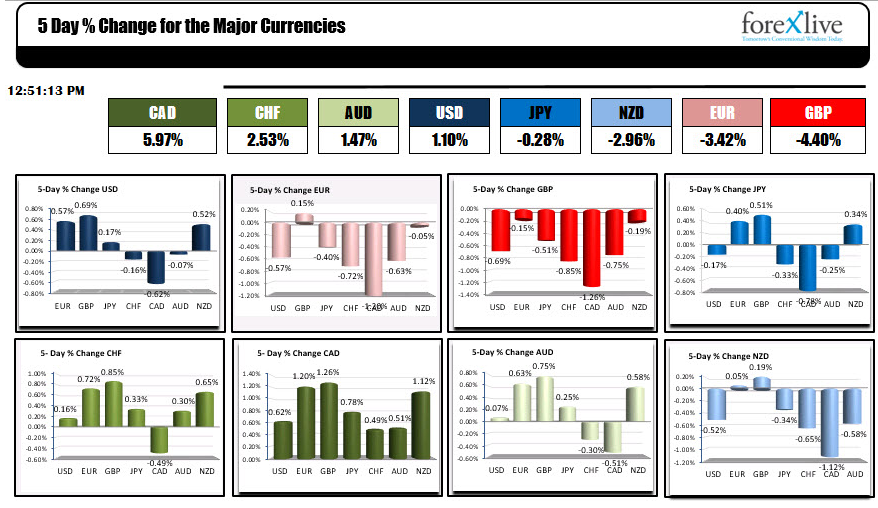
According to ForexLive, the AUD was also one of the better performing currencies in the work week ended Friday 3 August, rallying 1.47% against the major currencies:
If you took the % changes of the major currencies (USD, EUR, GBP, JPY, CHF, CAD, AUD and NZD) vs each other, and added up those values, you could rank the strongest and the weakest. Note the changes are not weighted (like the DXY index is weighted), but just a raw sum of the changes.
The below charts shows a snapshot currently of those moves:
Advertisement
However, the last week’s CFTC data also showed markets moving more aggressively short the AUD at -51.5k contracts, the shortest in two years:
The combination of still strong US growth plus rising interest rates and weakening Chinese growth and stimulus is the dual driver of the bearishness.
Leith van Onselen is Chief Economist at the MB Fund and MB Super. He is also a co-founder of MacroBusiness.
Leith has previously worked at the Australian Treasury, Victorian Treasury and Goldman Sachs.