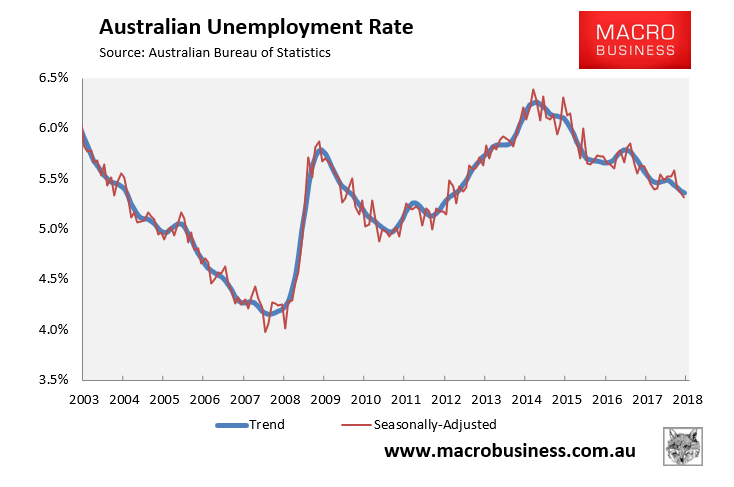
As summarised earlier, the Australian Bureau of Statistics (ABS) today released its labour force report for July, which registered a 3,900 decrease in total employment but a 0.1% fall in the headline unemployment rate to 5.3%, driven by a fall in labour force participation.
In trend terms, the unemployment rate fell marginally from 5.38% to 5.36%:
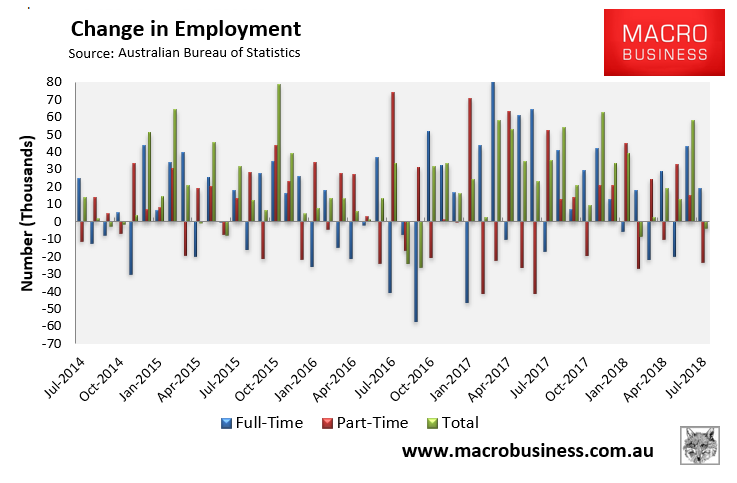
Again, total employment fell by a seasonally adjusted 3,900 to 12,575,200. Full-time jobs increased by 19,300, whereas part-time employment decreased by 23,200:
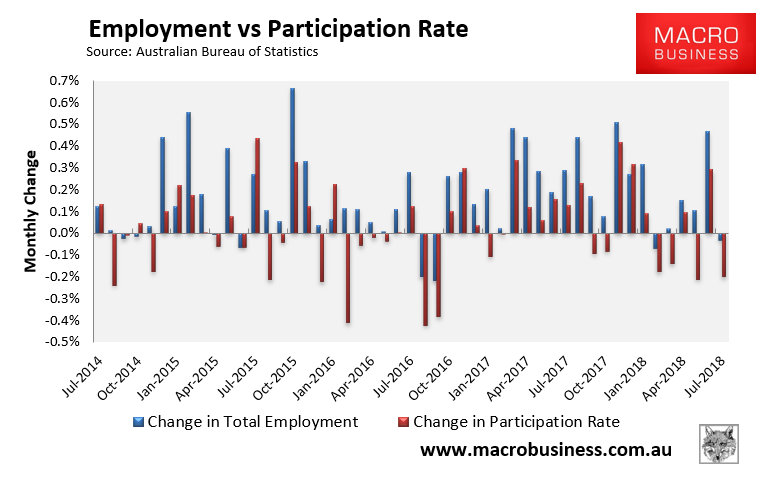
The participation rate fell by 0.13% to 65.54%, which is the main reason why the unemployment rate fell despite falling jobs:
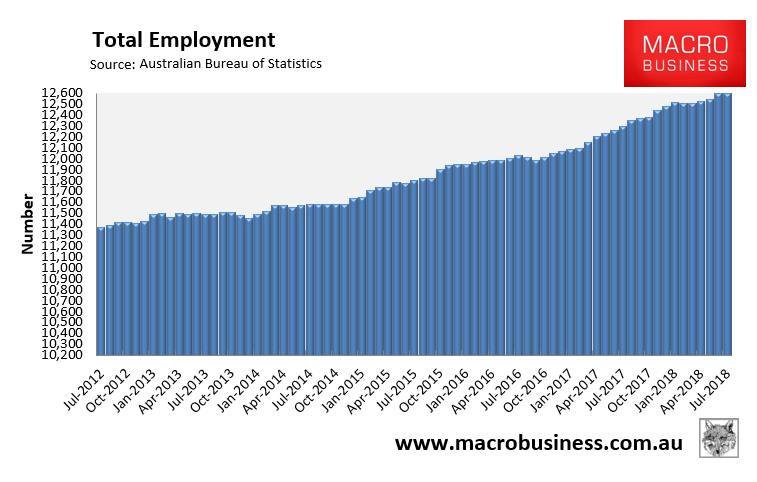
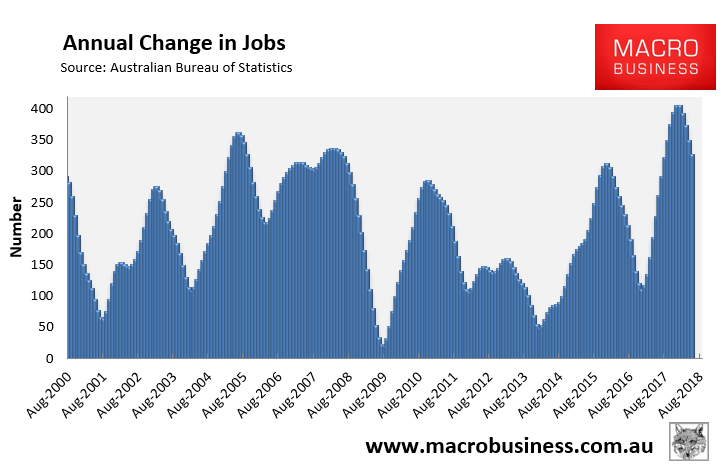
Total employment continues to trend higher, although the rate of growth has clearly slowed from the boom levels recorded six month ago:
The trend annual growth rate is also fading (+2.4%) on the back of weakening full-time employment growth (+2.1%), whereas part-time employment growth is rising (+3.1%):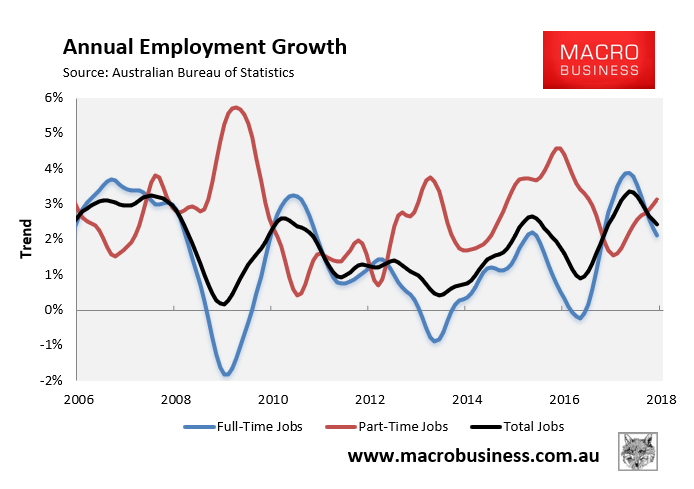
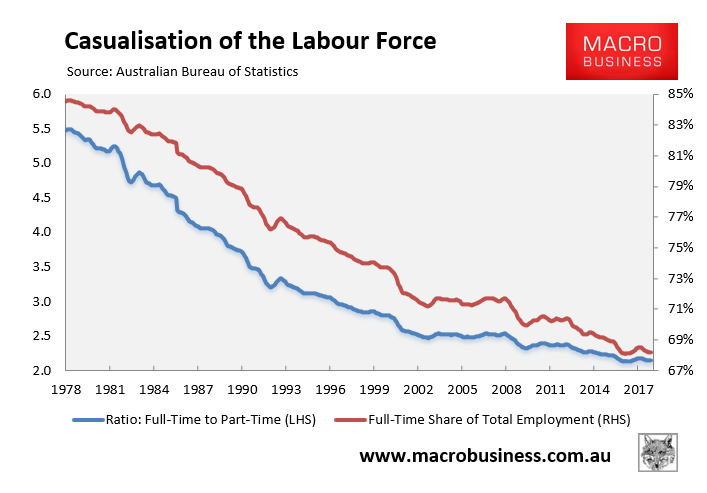
The proportion of the population in full-time work has also begun to fade again after recovering recently:
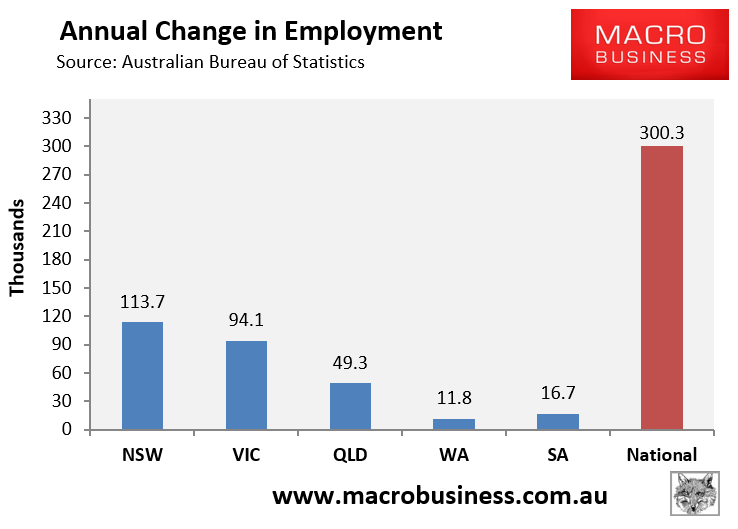
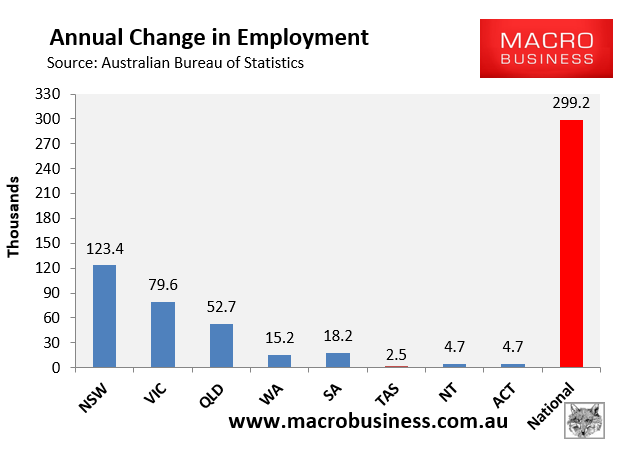
In July, NSW has easily led jobs growth over the past year in seasonally-adjusted terms:
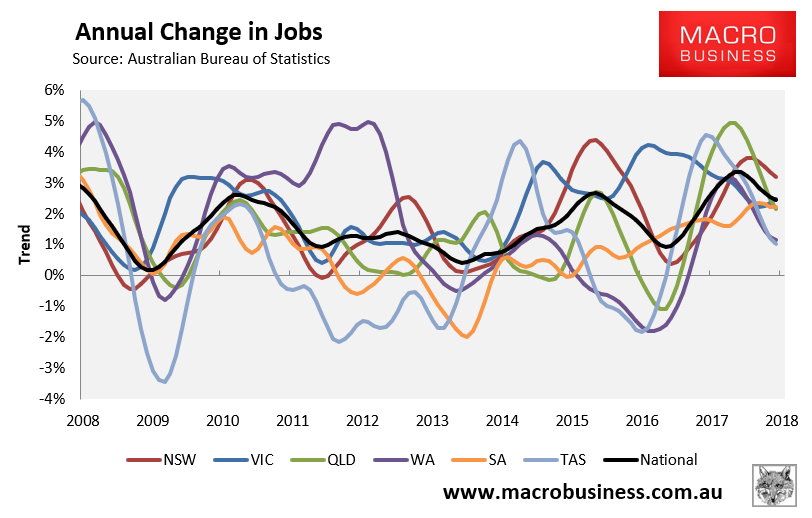
The state seasonally-adjusted figures are notoriously volatile and subject to a big margin of error. As such, the below chart tracks state jobs growth in trend terms. Here, the three major jurisdictions have driven the jobs growth:
All states are now experiencing annual jobs growth in trend terms, although growth is fading across all jurisdictions:
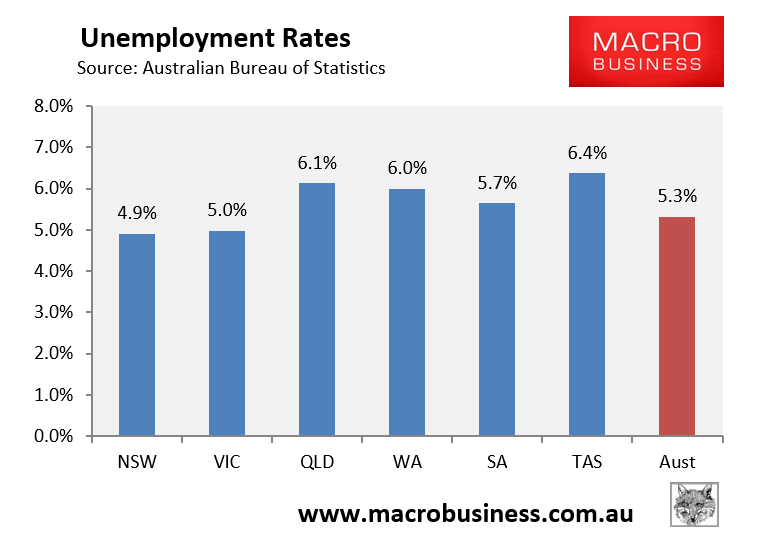
TAS and QLD now have the highest seasonally adjusted unemployment and NSW and VIC the lowest:
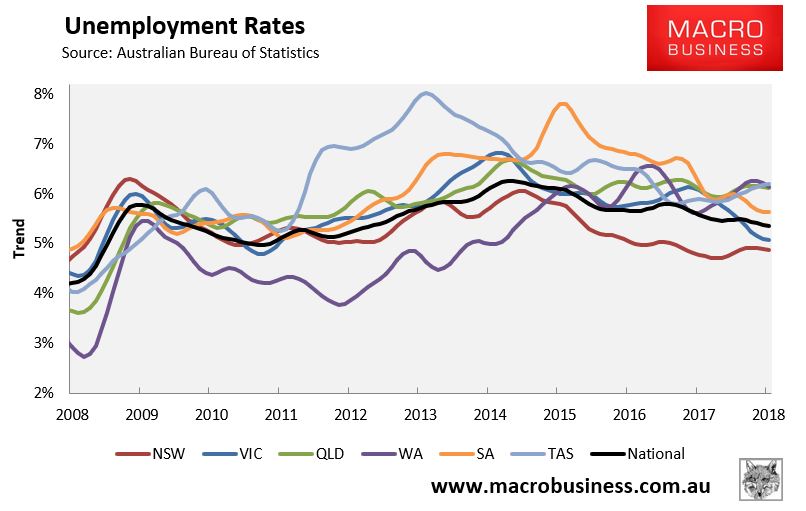
However, the below chart shows the ABS’ more reliable trend unemployment rates, which shows NSW and VIC with the lowest unemployment and WA, QLD and TAS with the highest:
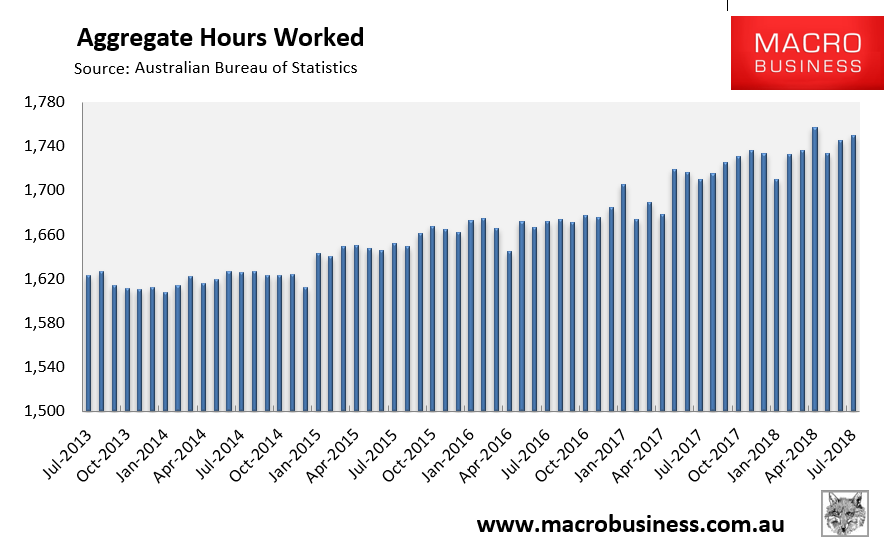
The aggregate number of hours worked has partly recovered from May’s heavy fall, rising again in July in seasonally adjusted terms. Total hours worked rose by 4.0 million hours or 0.23% in July. Hours worked have also risen by 2.3% over the past year:
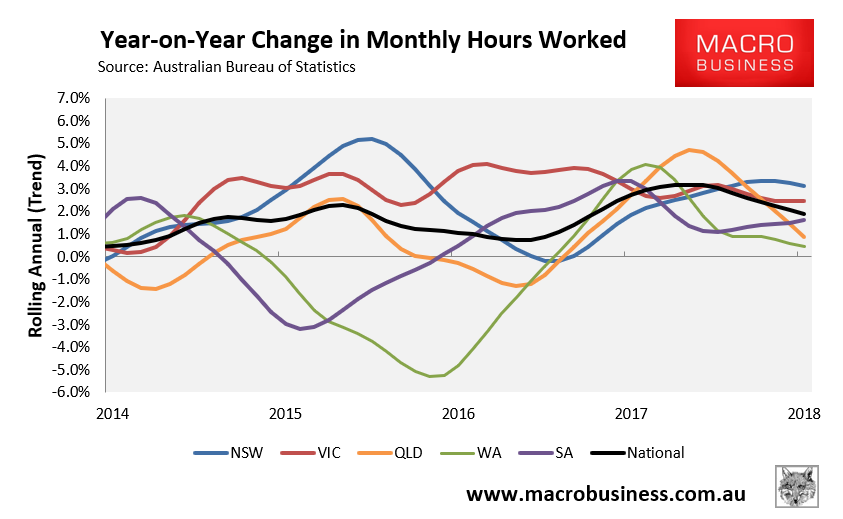
The below chart, which tracks the annual change in hours worked on a trend basis, paints a mixed picture, with differing growth across jurisdictions but 1.9% growth recorded nationally, with a falling trend:
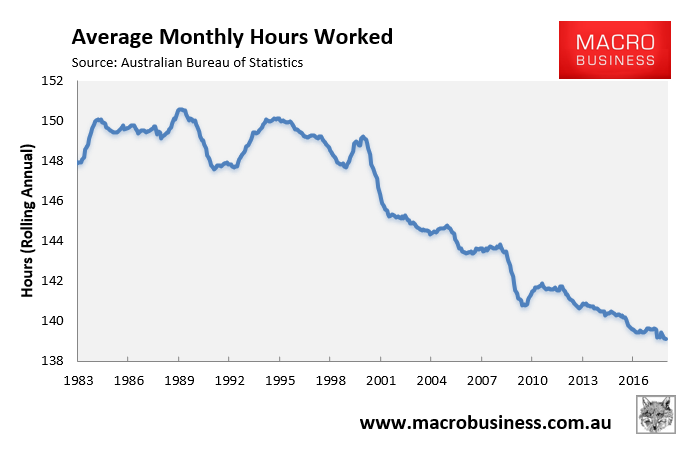
Average hours worked is also stuck at all-time lows:
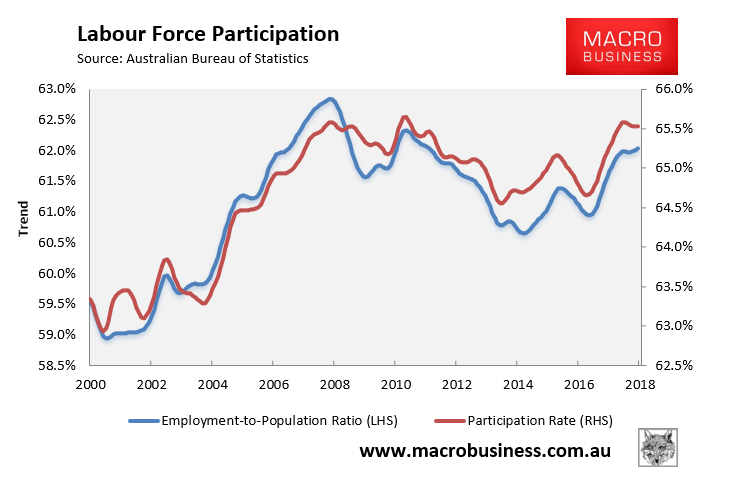
However, workforce participation is tracking near all-time highs:
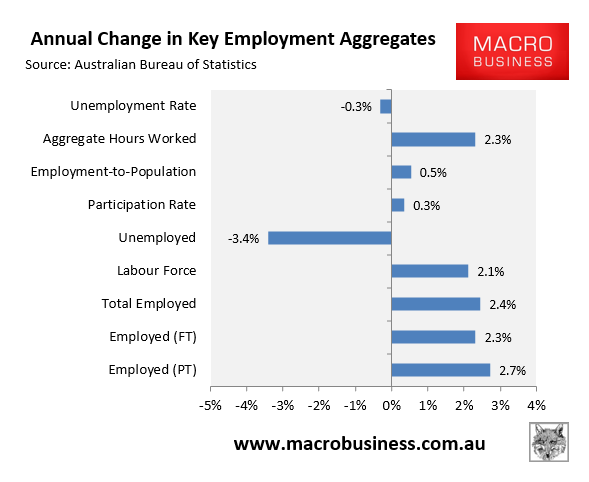
Finally, the next chart summarises the annual change in the key employment aggregates on a seasonally-adjusted basis, which shows a broadly recovered labour market:
In summary, after a good year-and-a-half of employment data, the labour market does appear to be softening given:
- Falling trend hours worked;
- Falling trend jobs growth; and
- Falling trend full-time jobs growth.
Significant labour market slack remains, which means wages growth will likely remain stunted.
