With CoreLogic’s July results reporting another month of falls for Sydney and Melbourne housing, I thought it was timely to take a deeper look at both markets using CoreLogic’s various measures.
But first, let’s recap both market’s performance at the aggregate level using CoreLogic’s marque hedonic index.
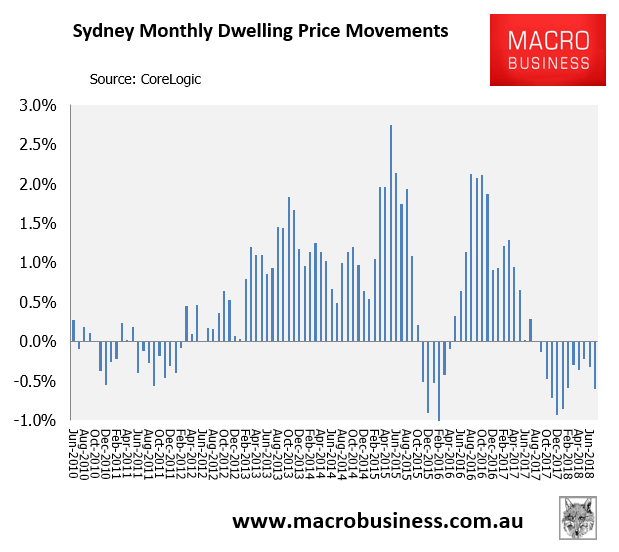
As shown in the next charts, Sydney recorded a 0.6% decline in dwelling values in July – the 11th consecutive monthly decline:
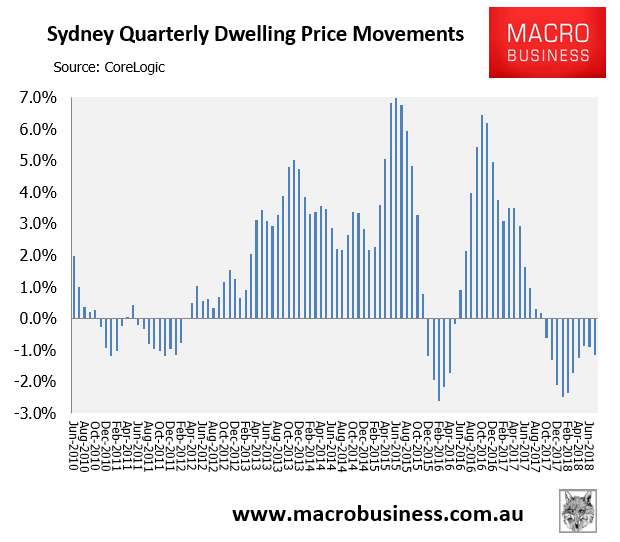
Over the July quarter, Sydney’s dwelling values declined by 1.1%:
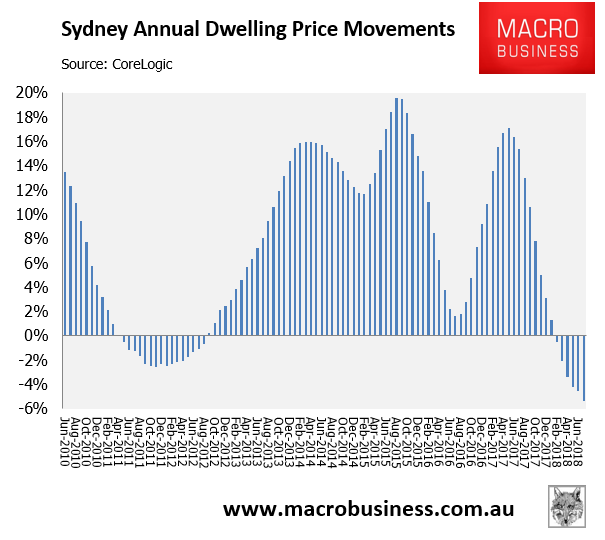
Whereas over the year, Sydney’s dwelling values fell by 5.4% in the year to July:
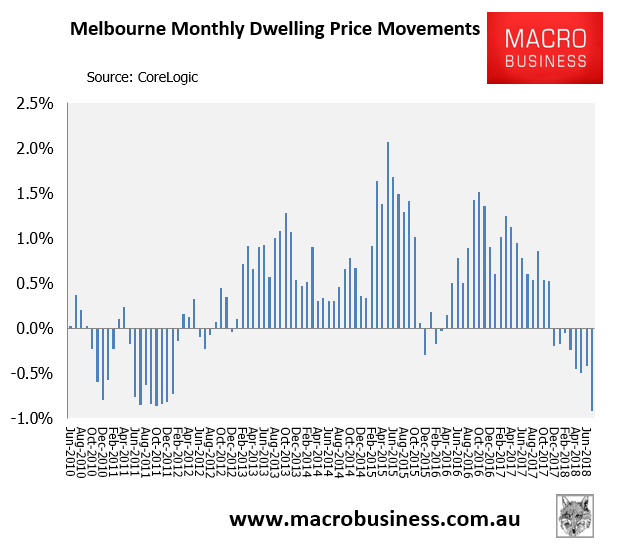
Turning to Melbourne, the city recorded a 0.9% decline in dwelling values in July – the 8th consecutive monthly decline:
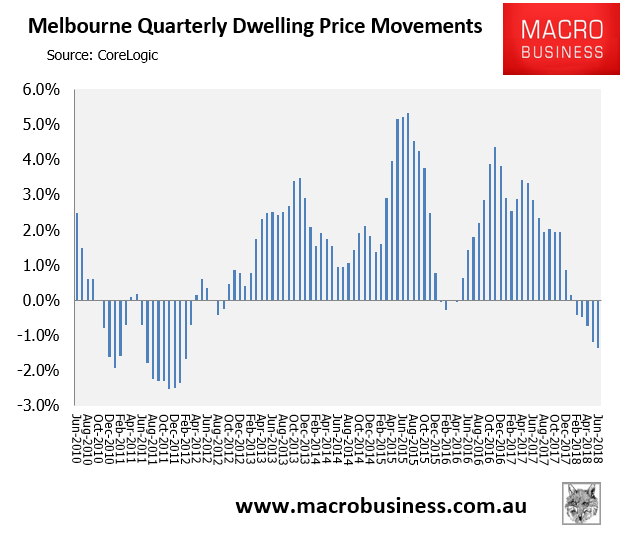
Over the July quarter, Melbourne’s dwelling values declined by 1.4%:
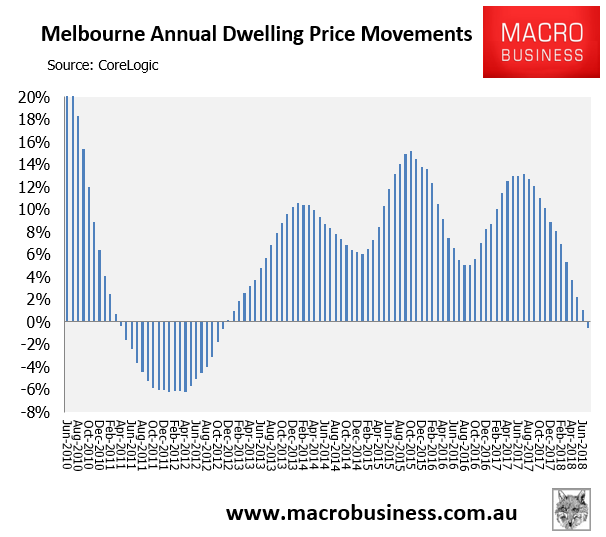
Whereas over the year, Melbourne’s dwelling values fell by 0.5% in the year to July:
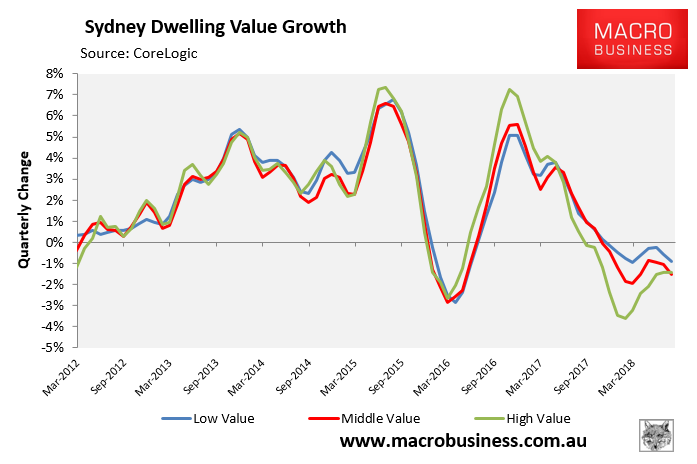
As noted previously, first home buyer (FHB) stamp duty incentives were introduced in both NSW and VIC from 1 July 2017, which has helped prop-up values at the more affordable end of both city’s housing markets.
As shown in the next chart, CoreLogic reports that the bottom 25% of dwellings by value in Sydney fell by 0.9% in the July quarter, versus a 1.5% decline across the middle 50% of properties by value, and a 1.4% decline across the top 25% of properties by value:
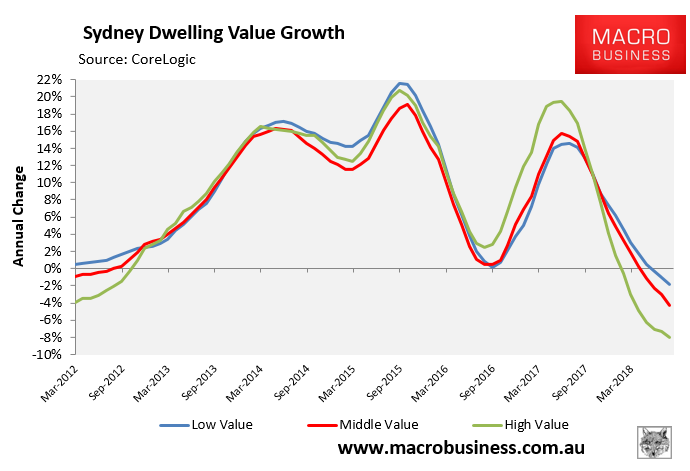
Similarly over the year, the bottom 25% of dwellings in Sydney fell by 1.8% as at July, versus a 4.2% decline across the middle 50% of properties by value, and a 8.0% decline across the top 25% of properties by value:
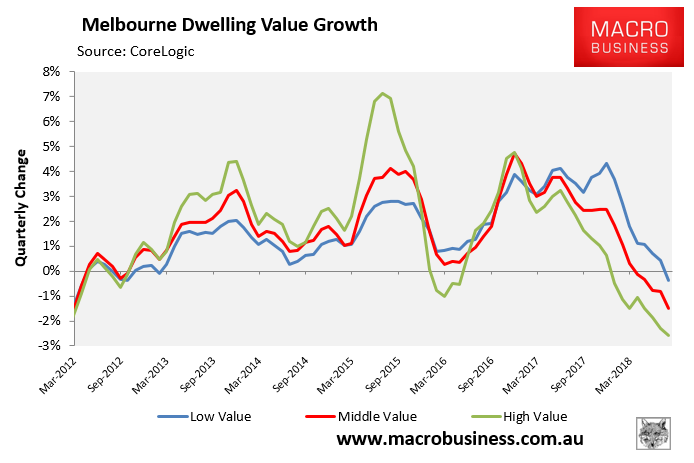
Likewise in Melbourne, CoreLogic reports that the bottom 25% of dwellings in Melbourne fell by 0.4% in the July quarter, versus a 1.5% decline across the middle 50% of properties, and a 2.6% decline across the top 25% of properties by value:
Whereas over the year, the bottom 25% of dwellings in Melbourne rose in value by 7.5% as at July, versus a 1.7% increase across the middle 50% of properties, and a 4.1% decline across the top 25% of properties:
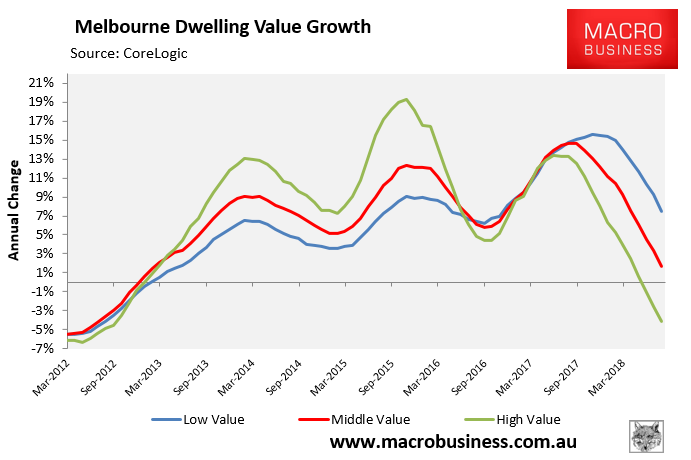
The above charts suggest that dwelling prices would have fallen much further in Sydney and Melbourne if not for the FHB bribes implemented by both state governments.
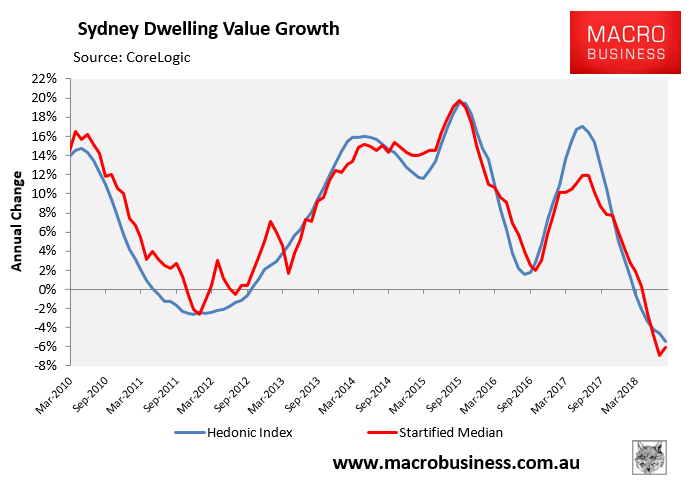
Next, CoreLogic’s monthly stratified median index shows sharper annual value losses in Sydney to its hallmark hedonic index (i.e. -6.1% versus -5.4%):
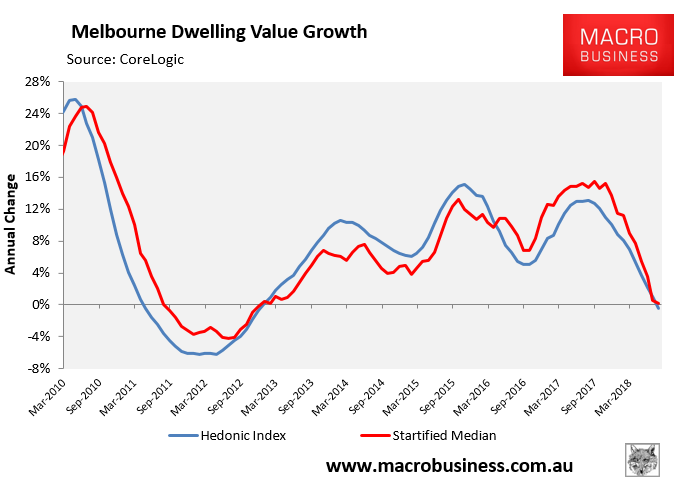
Similarly, CoreLogic’s stratified median index shows stronger annual growth in Melbourne (+0.2%) than its hedonic index (-0.5%), albeit with similar trends:
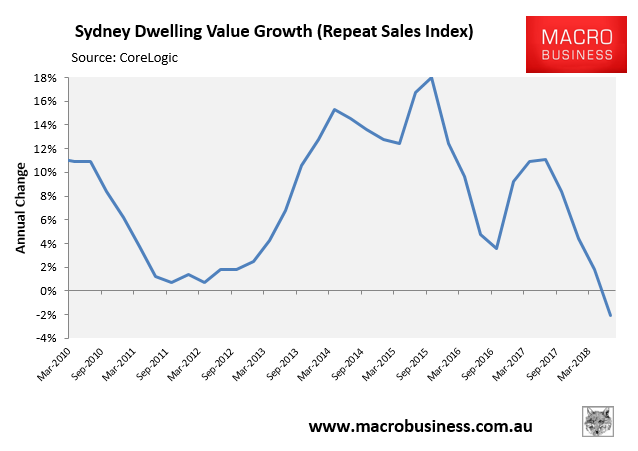
Next, CoreLogic’s Repeat Sales index, which is current to June, shows Sydney’s dwelling values fell by 2.1% in the year to June:
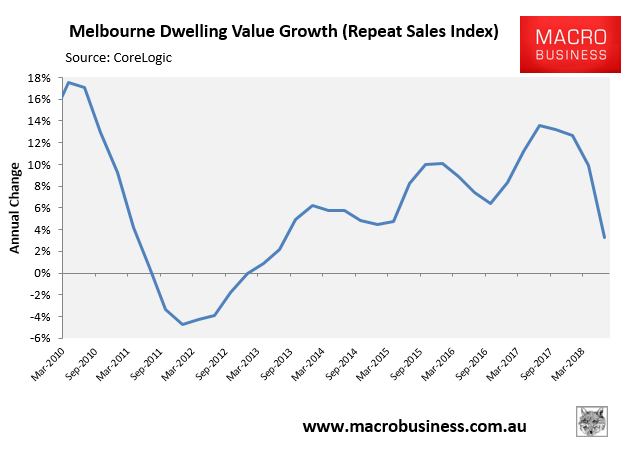
Whereas Melbourne’s dwelling value growth fell to 3.3% in the year to June:
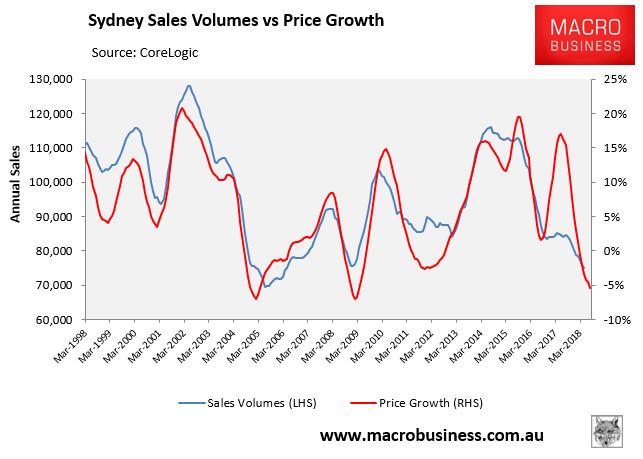
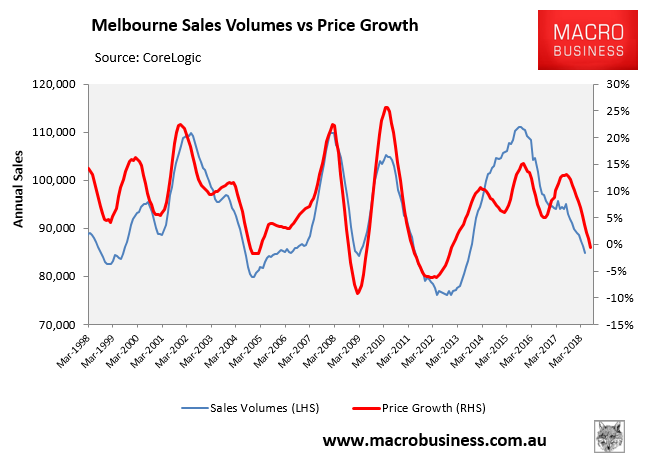
Finally, sales volumes are 35% below their July 2014 peak, whereas they are 24% below their August 2015 peak in Melbourne, both of which augers badly for dwelling price growth: