
I’ve waded through Matt Comyn’s presentation of CBA’s results and some things struck me as, bluntly, lacking clarity.
There’s no doubting CBA has a valuable franchise inherited mainly from its government owned history and its does have leading tech in delivering customer outcomes, but when it comes to the capital and liability side of the balance sheet, facts disappear and bankers rhetoric takes over.
The most important factor in the balance sheet of a bank is how much regulatory capital a bank must hold against its assets whether actual or risk weighted. The level of capital determines the level of gearing which is instrumental in the return on equity and therefore the value of equity. If anything significant came out of the Murray Financial Inquiry it is the notion that our banks should be “unquestionably strong” relative to international peers.
The important measure of capital is Common Equity Tier 1 (“CET1”) which is made up of ordinary shares and some forms of preference capital. Simply put a bank’s balance sheet is Capital (ordinary and preference share etc) plus Liabilities (borrowings, deposits etc), equals, Assets (loans etc).
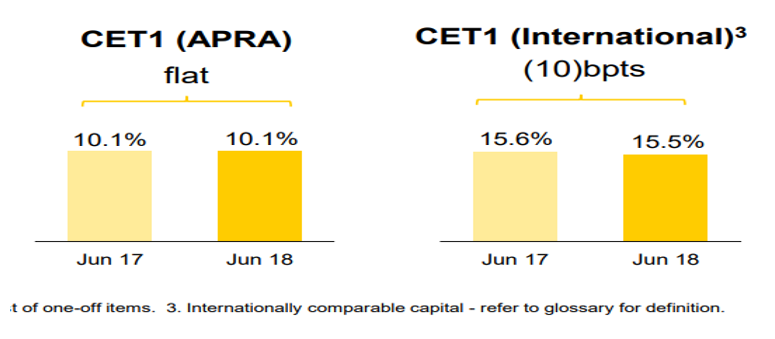
Firstly it’s interesting that CBA states that the bank is on a “clear path to unquestionably strong” and produces this graph in slide 12.
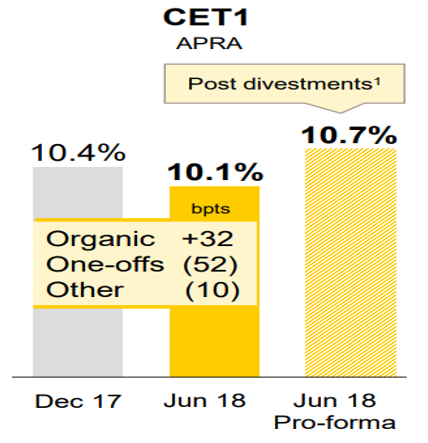
This graph shows that CBA’s CET1 capital ratio has decreased and will only increase very modestly, post divestment of its wealth management and broking businesses. Hardly a clear path to “unquestionably strong” but we’ll have more observations on this topic later in the paper.
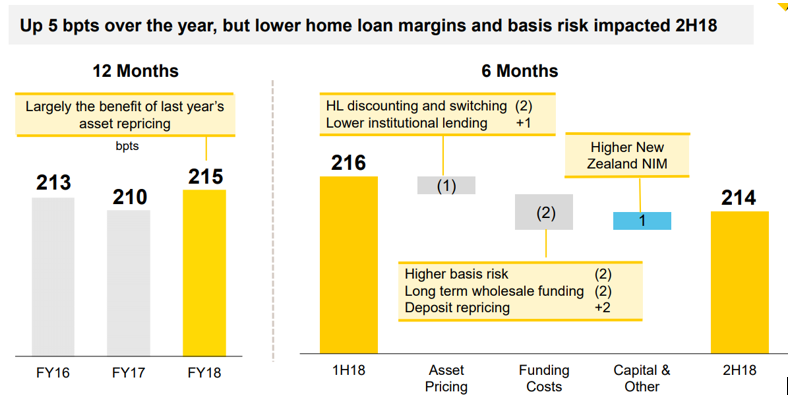
CBA’s group margin is outlined in slide 19 and clearly demonstrates how the bank protects its margins by asset repricing balancing against higher funding costs. The recent increases in the basis risk ie the spread of BBSW to the cash rate has the effect of “every 5 bpts of elevated BBSW/OIS spread costs ~1 bpts of Group NIM”.
My focus on margin however, is the very large 5 bpts of margin gained in the second half of the financial year by repricing the home loan book, primarily interest only and investment loans. Repricing the loan book to maintain margin maybe a survival strategy but its hardly a growth strategy.
This brings us to the predictable lack of information on arrears or at least home loan arrears. As we can see from the slide 24, home loan arears (90+ days) have increased 35% in the last 3 years from 0.52% to 0.70%. With one’s rose coloured glasses on perhaps we could say that its pretty immaterial, but is it? Here is where there is a lack of information to answer the question.
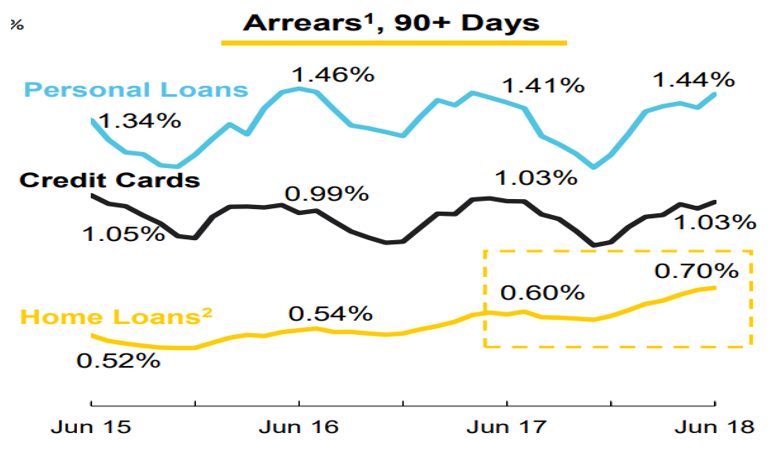
Nowhere in the presentation is the CBA definition of what constitutes a 90+day arrears or more detail provided on arrears. Is it a missed payment or a scheduled balance definition, or more importantly are those borrowers who’ve been granted hardship status and therefore payment holidays of up to 12 months included in arrears or not, (most likely not)? Why can’t CBA in these times of increasing mortgage stress present 30 and 60 day arrears as well as the 90+ days?
It’s very important for the market to know how many borrowers are not making monthly payments on their mortgages and how long they have been in arrears no matter the circumstances. CBA (and other banks) failure to supply this data is not conducive to the market being able to properly value the bank.
Fortunately, there is another source of information on CBA mortgage risk through the Basel III Pillar 3 Report and that report produces the following table showing the estimated probability of default bands for CBA’s retail exposures.
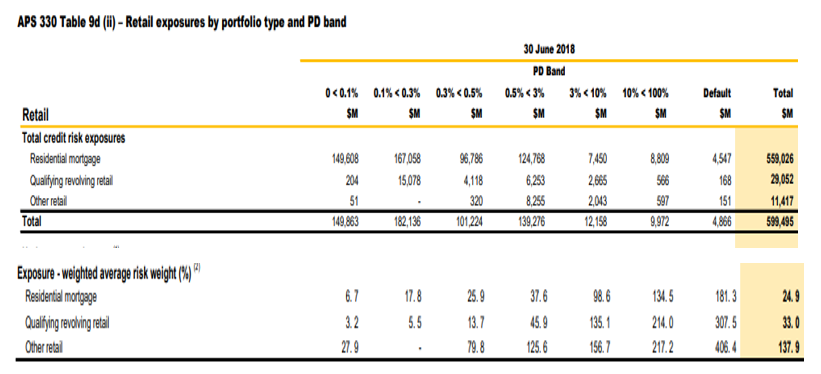
Some highlights from this table would be that the percentage of residential mortgages in default ( 90+ days in arrears) is over 0.8% (not the 0.70% disclosed in the presentation) and the total amount of loans with a probability of default above 3% (high risk for mortgages) is over $20Bn (>3.5%). My experience tells me that most if not all of the $20Bn would be at least 30 days in arrears. Perhaps not so rosy in a weak housing market.
My next observation concerns slide 52 and the mighty CBA (and wider bank) rort. CBA purports to internationalise their CET1 ratio to make the balance sheet appear much stronger, or unquestionably strong, when it’s demonstrably average.
CBA (as do other major banks) represent that on an international comparison basis that their capital ratios are much stronger than the APRA regime reflects. In the case of CBA a massive >50% better. This is patently an unprovable claim and can be proven false when each individual item is analysed.
I have been battling to shine a light on this issue for years both as Deep T and personally and have been the subject of abuse and threats for my efforts. I’ve been battling the banks, the ABA, PwC and APRA but no matter how they persist in the defence of the international capital comparison the lie is still a lie, even if only a few understand. The argument put forth is that APRA is a hard regulator and imposes rules on Australian banks that are tougher than overseas regulators so if we are to compare banks internationally then the APRA capital requirements should be adjusted to take into account these adjustments. The issue is that the argument does not stack up under scrutiny.
Let me again point out a few elementary but significant factors that prove the banks and others international capital comparison representations are false. First from CBA’s Pillar 3 disclosures.
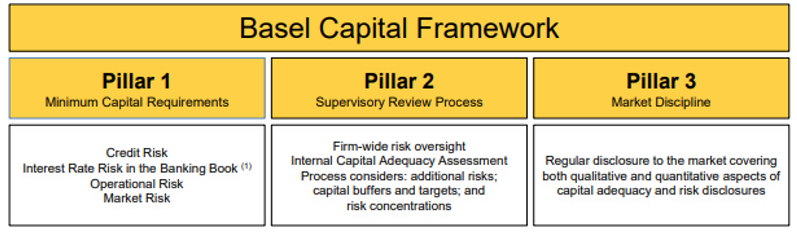
The Basel framework has three Pillars as above. Pillar 1 are the basic minimum capital requirements whilst Pillar 2 allows local regulators (like APRA) to adjust minimum capital requirements as they see fit for the circumstances. APRA does these Pillar 2 adjustments both publicly and privately as does every other regulator. In which case it’s not possible to directly compare Australian Banks capital requirements with international banks by adjusting APRA’s Pillar 2 requirements to MINIMUM Pillar 1 capital requirements. It does not make sense nor could it ever be accurate because the banks, APRA, the ABA nor PwC do not know what Pillar 2 adjustments all the other regulators are making to their regulated banks’ minimum capital requirements.
The 3 Pillars of the Basel Capital Framework were designed so that you could compare internationally or across regulators without adjustments. Theoretical adjustments to minimum requirements without knowledge of all Pillar 2 adjustments that all regulators make does not stand up to any close scrutiny.
To provide one demonstration of the absurdity of a purported adjustment, on slide 131 that outlines the adjustments to capital, the following is the adjustment for residential mortgages:
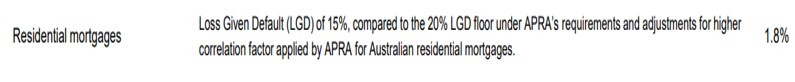
On Table 9d (ii) of CBA’s Pillar 3 report above, it states clearly that the average risk weight for residential mortgages is about 25%. So according to that tough regulator APRA, CBA has minimum capital requirements against its mortgage book of 8%*25% = 2%. Nevertheless CBA represents that if CBA was regulated by any other regulator using the Basel regime, rather than APRA, that an adjustment of a massive 1.8% should be added to CBA’s CET1 capital. This implies that any other regulator would require CBA to hold almost no capital against its residential mortgage book; and APRA agrees with this absurdity. What more can I say?
Why is this issue so important?
It’s all about raising capital and return on equity. Unquestionably strong is meant to represent Australian banks being in the top 25% of international bank peers. CBA representing that internationally their CET1 ratio is 15.5% rather than 10.1% says they, and the rest of Megabank, are unquestionably strong, as per the CET1 ratios on slide 126.
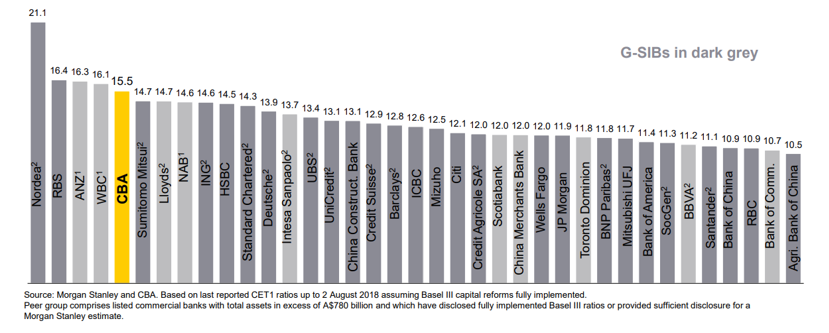
Using the true comparison of CBA’s CET1 ratio of 10.1%, CBA and no doubt the rest of Megabank, would be right down the tail of the graph and nowhere near top 25%. As further demonstration of both the inaccuracy and the sloppiness of the international comparison, three of the banks that CBA adjusts its capital comparison against are big American banks, Wells Fargo, JP Morgan and Bank of America that are not even on the Basel framework that CBA adjusts. Seriously inept.
The CET1 ratio misrepresentation by CBA is about saving a minimum of $25Bn in ordinary capital that they should raise to be “unquestionably strong” and that’s without any stress in the mortgage market. That’s the burden being taken by the Australian taxpayer under the too big to fail doctrine. As the rest of MegaBank and the total amount of undercapitalisation would be close to $90Bn.
So my takeaways from CBA’s latest accounts are that CBA will use any excuse to reprice the back book to protect margins; CBA is not forthcoming with details on loan arrears in its mortgage book but the available information does indicate that there are some red lights flashing; and the CBA balance sheet is materially less strong than its accounts indicate to the tune of $25Bn of Tier 1 capital, and at the expense of the Australian taxpayer.
The Banking Royal Commission could do the taxpayers of Australia a great favour by shining a light on this issue.