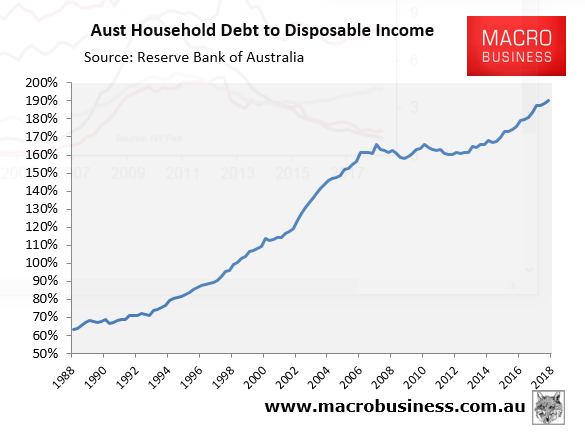
The latest data on household debt from the RBA shows that Australia’s household debt-to-disposable income ratio hit a record high 190% in March 2018:
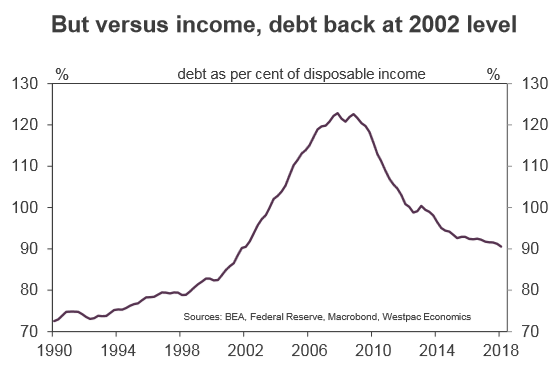
With this in mind, it’s interesting to read Elliot Clarke’s (Senior Economist at Westpac) analysis showing that US household debt-to-disposable income (90%) is now back to 2002 levels and less than half Australia’s:
Advertisement
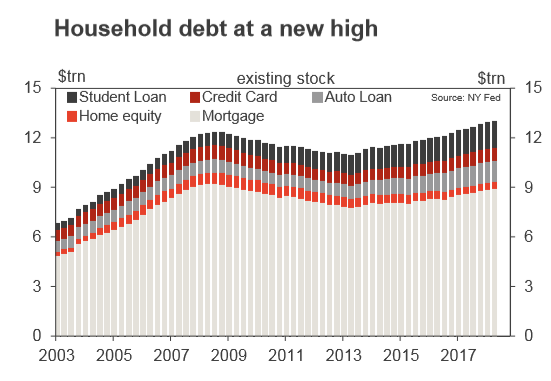
Each quarter, the New York Federal Reserve release their ‘Household Debt and Credit Report’. It provides a deep dive into the composition, growth and credit quality of US household debt across its key sub-components.
For the three months to June, the New York Fed report that total US household debt reached a new all-time high of $13.3trn. This result is 19% higher than the post-GFC low of June 2013, $11.2trn, and 5% above the prior peak of $12.7trn – recorded in the September quarter of 2008.
By sub-component, the majority of the increase in total debt has been due to the rise in mortgage debt outstanding (up $1trn since the June 2013 low, including first mortgages and home equity lines), while auto and student loans have each contributed a further $0.4trn to the total rise. Note though that the change in the last two categories have been disproportionate to their starting level, representing cumulative percentage gains of 52% and 41% respectively, compared to 12% for mortgages.
Against prior periods, credit has been an outsized support for consumption over the past five years, but only of marginal significance to housing. Emphasising the latter point, the five years prior to the previous peak (September 2008) saw mortgage debt rise 87% – seven times the growth seen in this episode.
From the above outcomes come a number of consequences worthy of note.
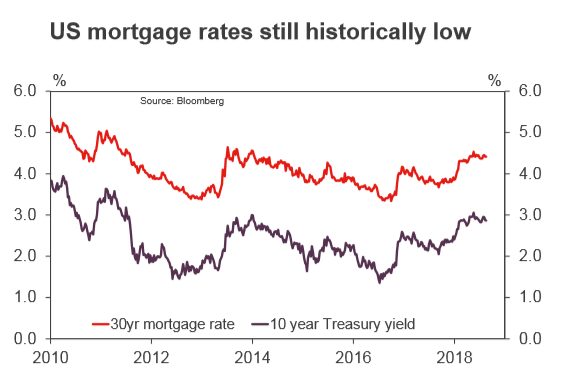
The first is the health of the housing market. Households that held onto their property through the GFC should have now built up considerable home equity, particularly if they took advantage of the sharp decline in the 30yr mortgage rate to historic lows in 2012 and again in 2016. Although new entrants face higher nominal prices, in real terms, national prices are still lower than the pre-GFC peak a decade ago, and the benefits of a strong labour market and still-low interest rates clear. It is for these reasons, along with still-limited property supply, that price growth and modest gains for new housing should persist – benefitting wealth and aggregate activity.
On the latter point however, a pull-back in build-to-let construction could offset continued gains for single new homes, negating the benefit for aggregate economic activity. Note that despite the weather improving in the June quarter, total residential construction still fell. It is therefore not a given that residential construction will be a net positive for the economy over the year ahead.
Turning to consumption, the sharp rise in debt associated with durables purchases and services spending (education) has to be factored in when assessing the outlook for household spending. In short, households that have accrued debt in the past need to repay the principal borrowed as well as associated interest costs. Until the loan is paid back, income available for discretionary spending is reduced.
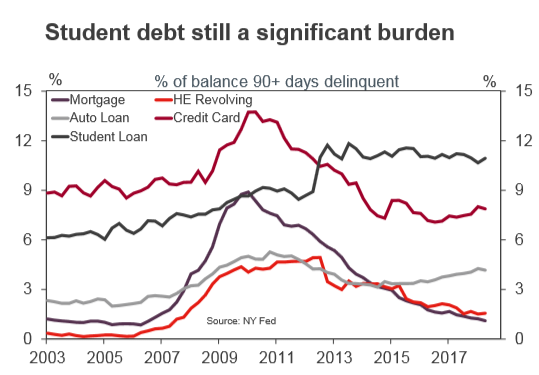
Although education should lead to a higher starting income and career progression, for many new entrants the post-GFC environment has made it tough to get a job commensurate with the education they have attained. This is highlighted both by the level of prime-aged participation remaining below its pre-GFC peak as well as the persistent weakness in real income growth. It is also why delinquencies on student debt remain at an elevated level, despite the unemployment rate being at multi-decade lows.
Looking ahead, we contend that despite a low level of debt relative to household income, the make-up of credit growth and new entrants’ difficulty in securing their earning potential will limit potential upside to consumption growth in the second half of 2018 and in 2019. This sets the scene for a material slowdown in aggregate US growth in mid to late-2019.
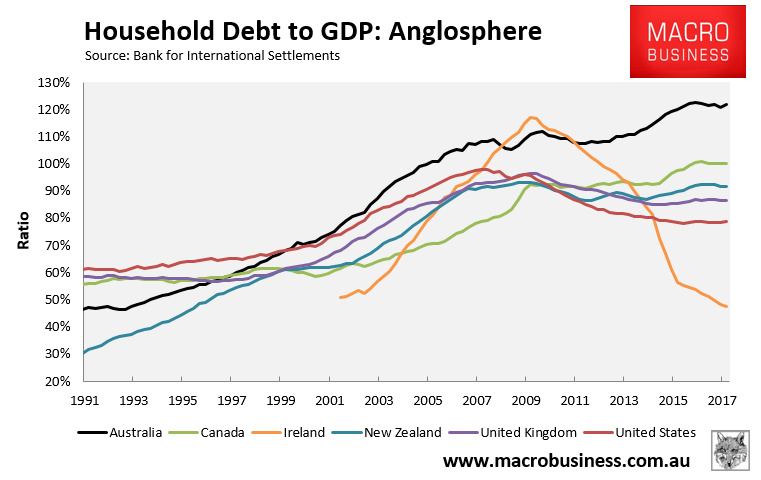
Of course, when measured against GDP, Australia’s household debt (122%) is also second highest in the world (behind Switzerland) and way above the US’ (79%):
Advertisement
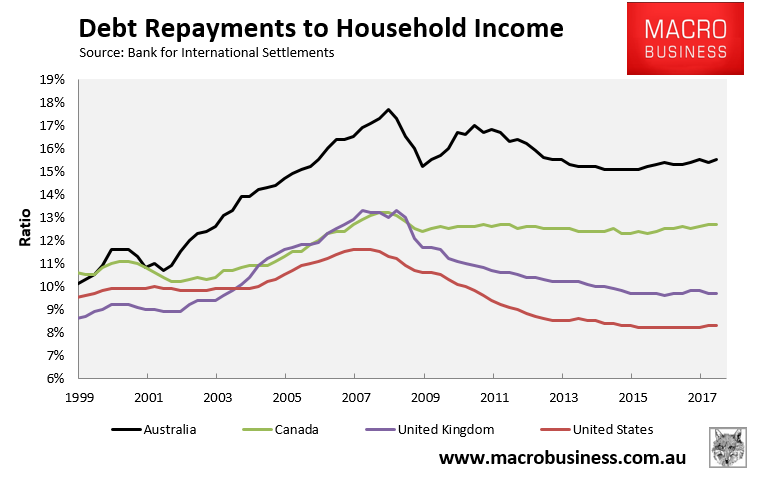
Whereas Australia’s ratio of debt repayments-to-income (15.5%) is also way above the US (8.3%):
Australia’s extreme household debt is an issue that doesn’t receive nearly enough attention.
Leith van Onselen is Chief Economist at the MB Fund and MB Super. He is also a co-founder of MacroBusiness.
Leith has previously worked at the Australian Treasury, Victorian Treasury and Goldman Sachs.