
CoreLogic’s latest dwelling sales data paints a sobering picture for those groups heavily reliant on property transactions, such as real estate agents and state governments (via stamp duty). It also points straight down for house prices.
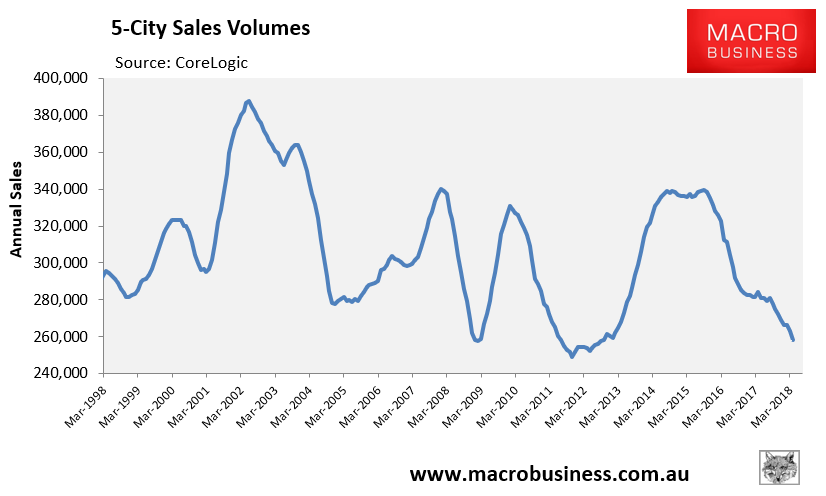
The next chart plots annual sales volumes across the five major markets to March 2018, which are falling fast and plumbing levels not seen since the 2011-12 housing bear market:
The next charts plot annual sales volumes across each major capital:
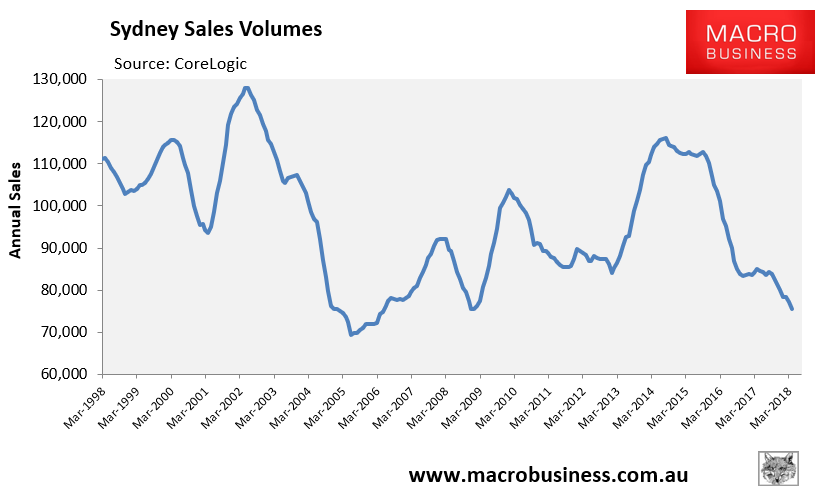
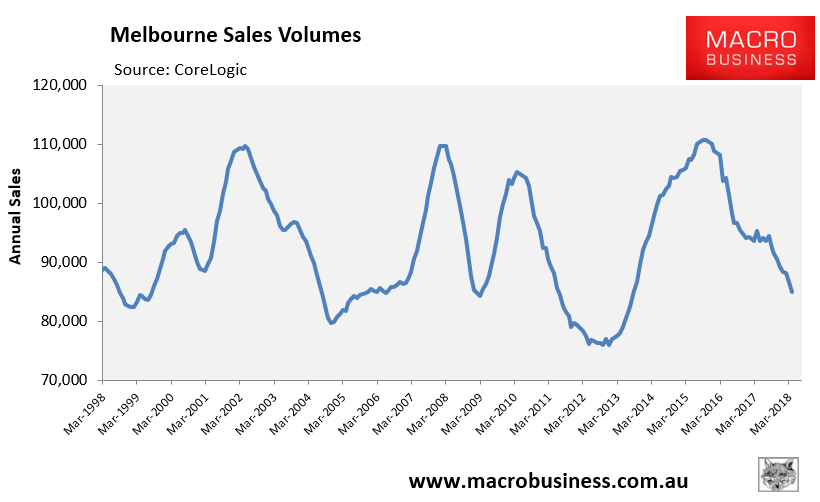
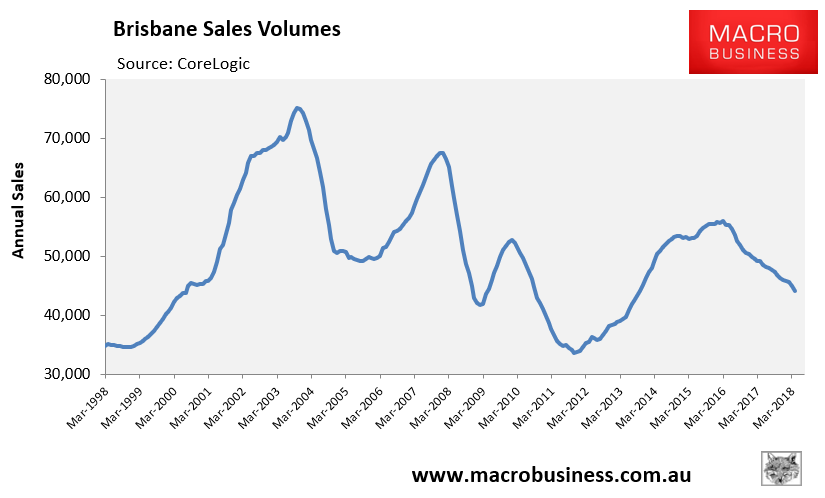
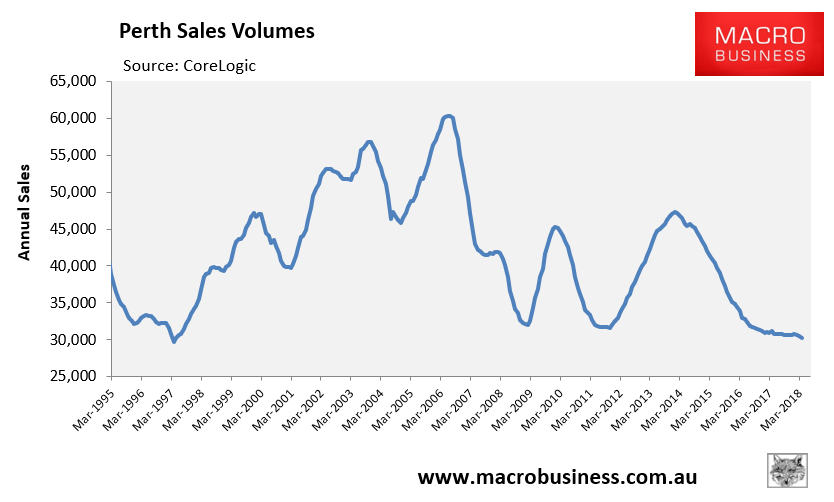
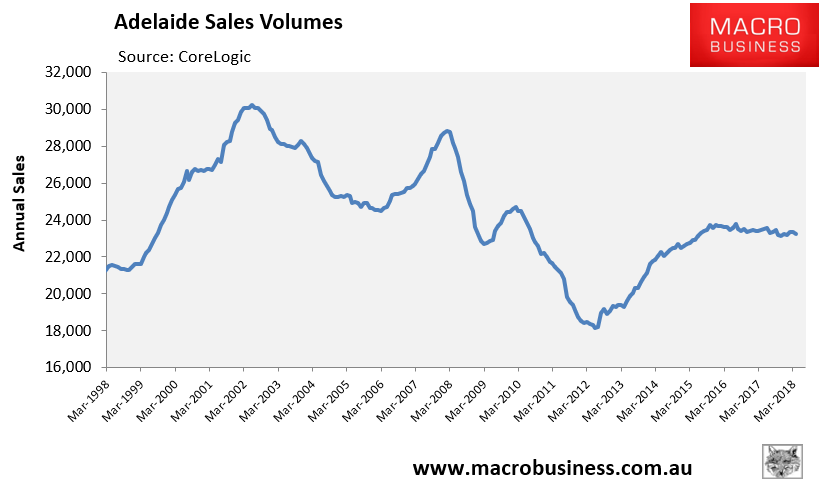
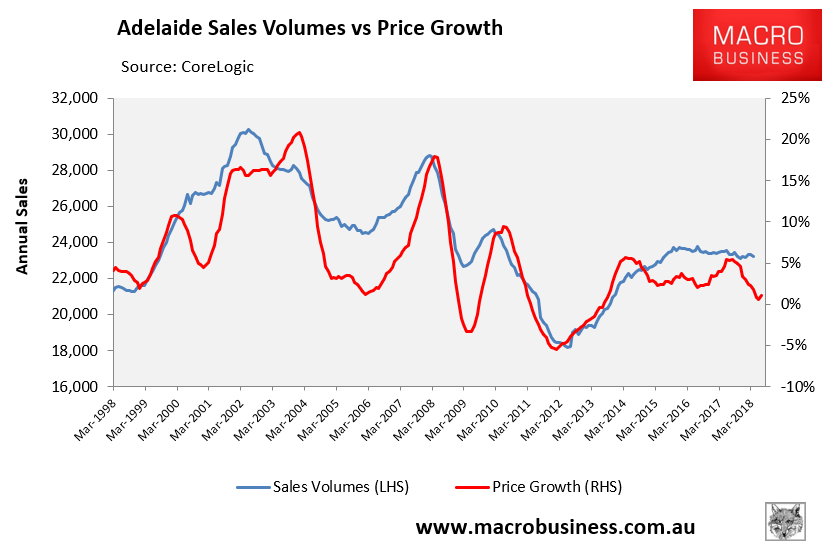
As you can see, sales volumes have fallen heavily across all major housing markets except Adelaide.
The following charts plot the annual changes in sales volumes and dwelling values, as measured by CoreLogic, which shows a very strong correlation:
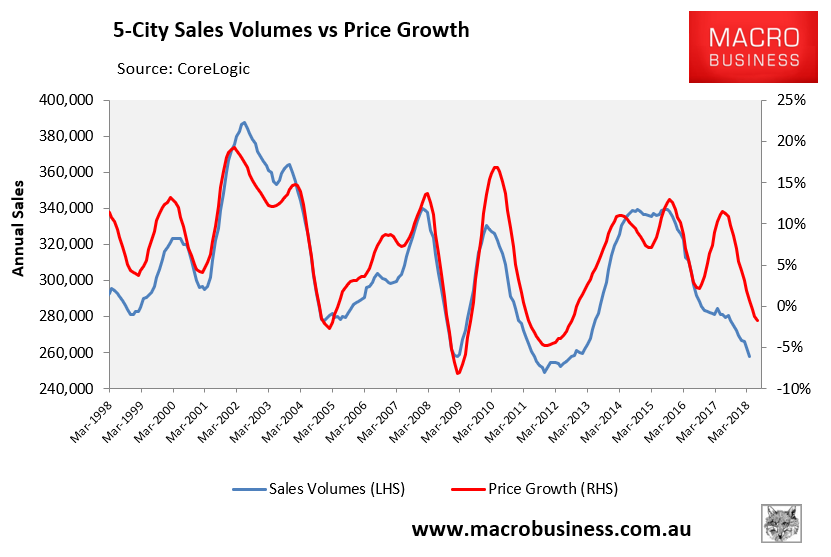
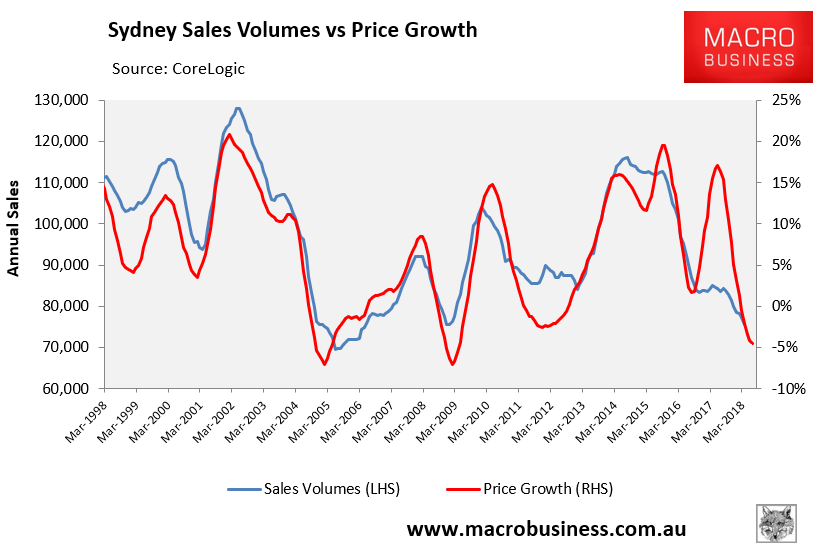
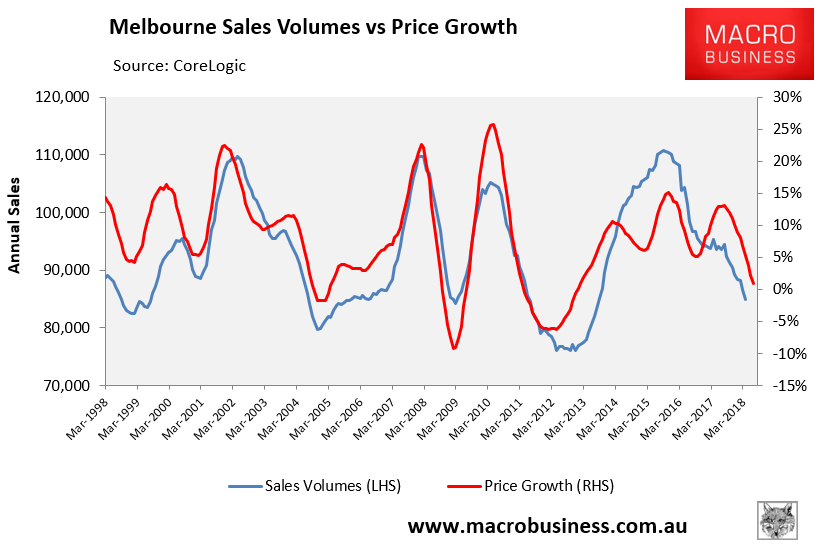
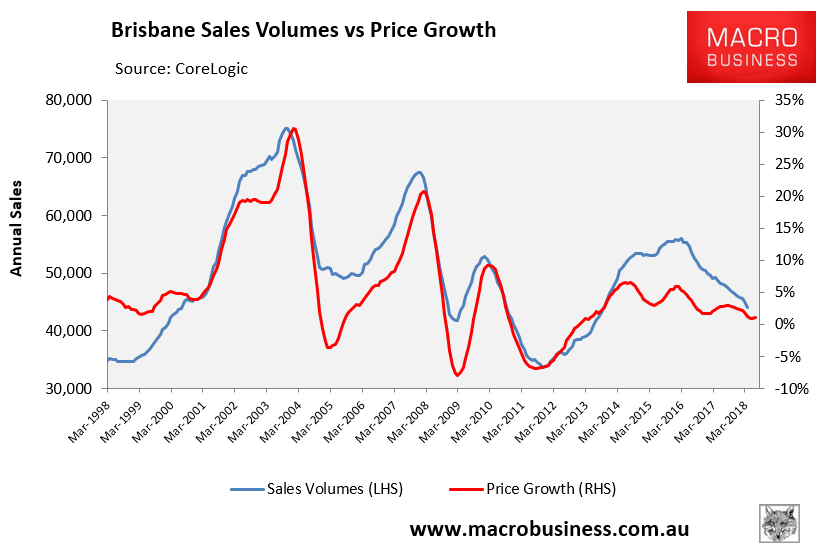
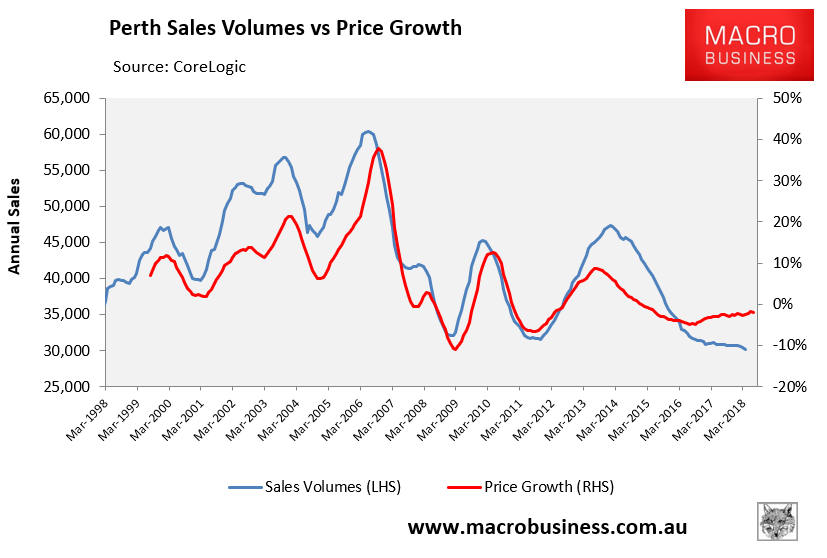
The collapse in sales volumes suggests that Sydney’s, Melbourne’s and Perth’s dwelling values will continue to fall, whereas Brisbane’s could soon follow.
