By Gareth Aird, Senior Economist at CBA
Key Points:
- A solid lift in consumer sentiment as well as a pick-up in retail sales, job vacancies and total employee earnings suggests there are some green shoots to the outlook for consumer spending.
- Falling dwelling prices, however, pose a risk to the outlook but so far Australian households seem unperturbed.
- We expect household expenditure growth to be 2.7% in 2018.
Overview:
Over the past few months there have been some green shoots in the data with respect to the consumer. A few decent monthly retail numbers suggest that consumer spending growth lifted over Q2 2018. And consumer sentiment printed at its highest level since late-2013 in July. In addition, forward looking indicators on the labour market continue to look healthy. They point to employment growth stronger than population growth over the next six months. This means that we should see some soft downward pressure exerted on the unemployment rate. Dwelling prices have been deflating. But so far the mild falls have not had any adverse impact on either consumer confidence or the spending decisions of households.
Ultimately household expenditure is driven by both the desire and the capacity to spend – the will and the way. Central to these outcomes for most households is: (i) having a job and feeling secure in it (i.e. employment); (ii) feeling confident about the economy and future earning prospects (i.e sentiment); (iii) income (i.e. wages) (iv) wealth (influenced by dwelling prices and to a lesser extent equity prices); and (v) the level of indebtedness. Each factor is covered in this note.
Latest data on consumer spending
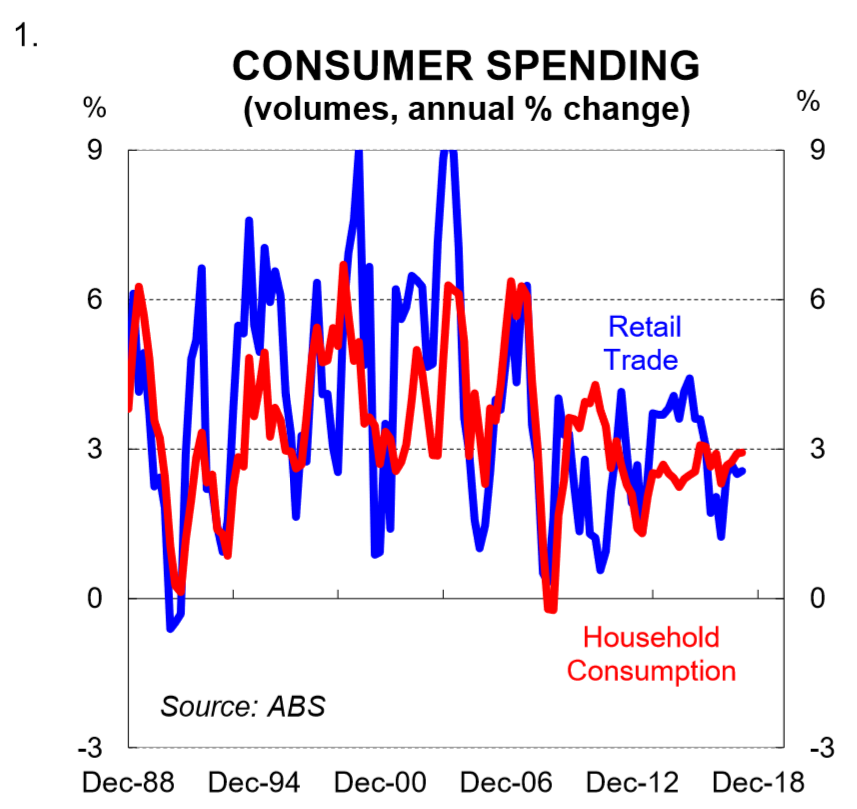
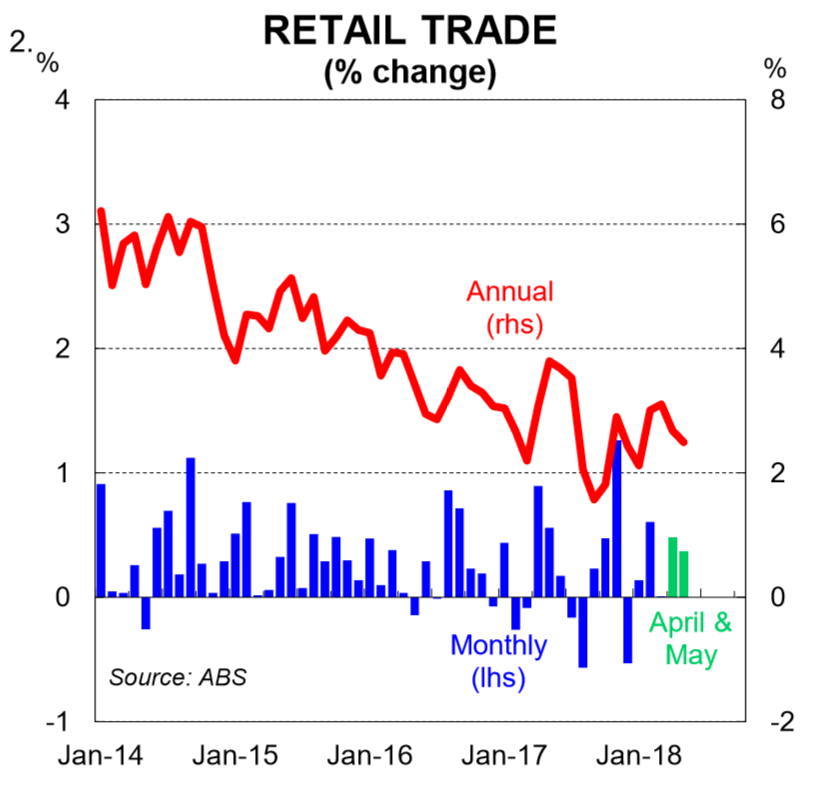
There are two key ABS publications that cover consumer spending – retail trade (monthly) and the national accounts (quarterly). Retail trade is a partial measure of household expenditure. It accounts for around 30% of total consumer spending. Unsurprisingly, it has a positive correlation with total household expenditure (chart 1). The most recent data indicates that retail sales growth accelerated in Q2. Retail spending rose by 0.5% in April and 0.4% in May. This suggests that the volume of total consumer spending is likely have lifted in Q2 after posting a soft 0.3% increase in Q1.
Influences on spending
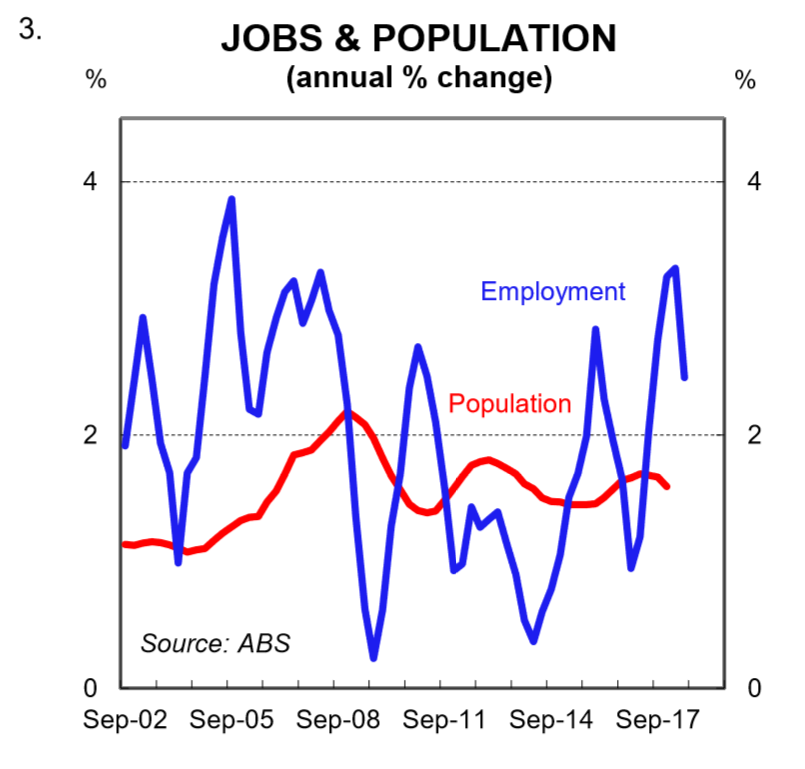
(i) Jobs: Employment growth has eased more recently. But it still remains well above population growth (chart 3). Over the year to May 2018, the ABS reports that employment rose by a solid 319k. Full-time employment (i.e +35hrs a week) rose by 179k while those in part-time employment rose by 125k. These are strong numbers. And from a consumption perspective, more people in employment (both in absolute terms and as a share of the population) means more spending, all else equal.
Looking ahead, the underlying fundamentals look positive. In particular:
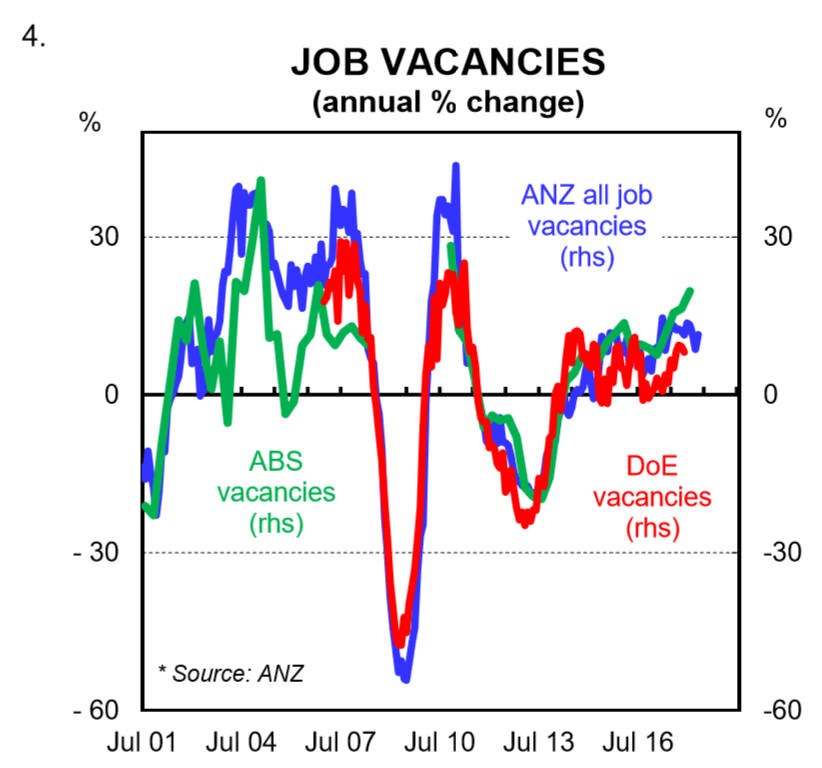
- measures of job vacancies are rising at a solid pace (chart 4). The ABS job vacancies posted a strong 5.7% rise over May to be 24.1% higher over the year;
- business surveys are sending positive signals on labour demand. The employment component of CBA’s Composite Purchasing Managers Index, for example, is well into expansion territory. The NAB Business Survey is also pointing to decent near term jobs growth;
- GDP growth is running above trend and forward looking investment intentions are consistent with growth in headcount; and
- unit labour costs have been broadly flat which has meant that labour has become relatively cheaper in Australia and more internationally competitive.
The RBA also maintains a positive view on the Australian labour market. Indeed, in his July Statement accompanying the monetary policy decision, RBA Governor Lowe noted that, “solid growth in employment is expected.”
(ii) Consumer sentiment: The mood amongst consumers has improved over the past three months. The Westpac Melbourne Institute index of consumer sentiment rose by a strong 3.9% in July to its highest level since November 2013 (chart 5). The index is now well above its long-term average. Consumer expectations around the economic outlook have improved despite dwelling prices deflating. This suggests that fears around a negative wealth effect may be overdone. And it also implies that households, as a collective, probably recognise that a small easing in dwelling prices isn’t such a bad thing after such strong growth in the prior years. Indeed, the sentiment survey showed a sharp lift in the proportion of Sydney respondents (possibly 1st home buyers) who saw now as a “good time” to buy. There has also been a lessoning in job security fears. Fears around unemployment have fallen 7.5% over the year.
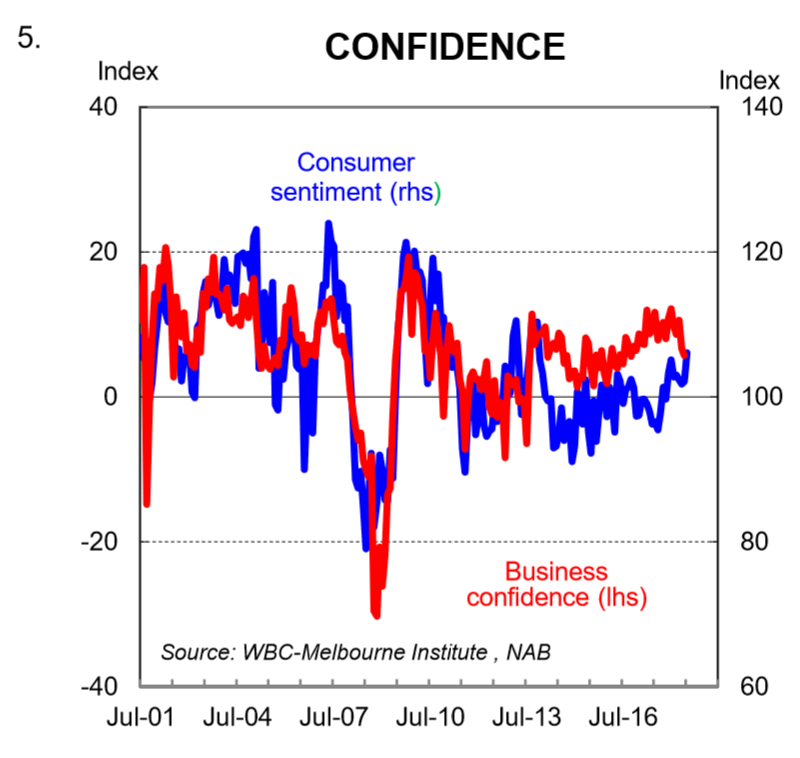
The lift in consumer sentiment has closed the gap between business and consumer confidence. Over time, divergences between consumer and business confidence tend to be ‘ironed out’ and the results converge. The recent coming together has been a result of a lift in consumer sentiment against a pullback in business confidence from a high level.
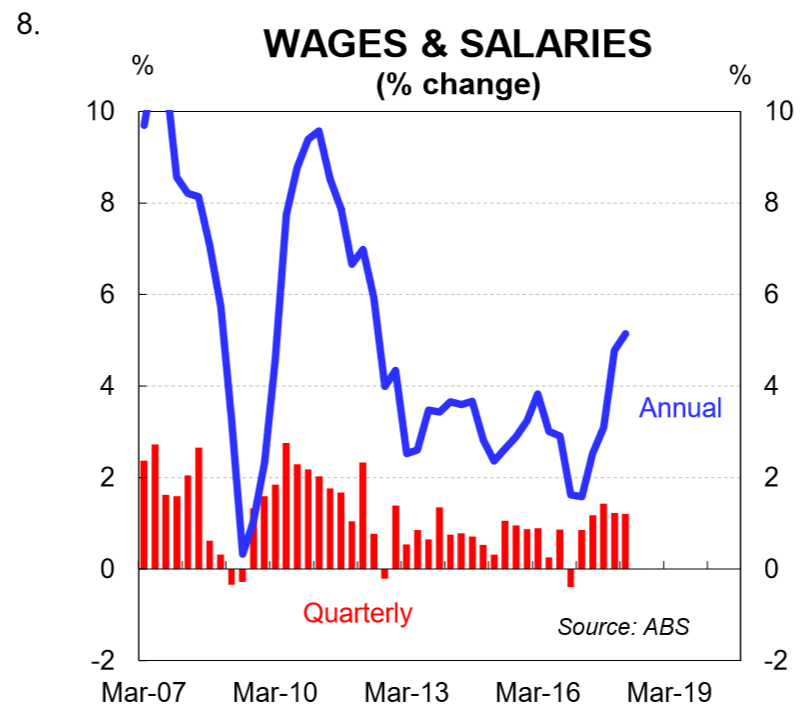
(iii) Wages: Growth in wages remains weak in Australia. The Q1 Wage Price Index (most recent) rose by just 0.5% and the annual rate was steady at 2.1%. There is still a lot of spare capacity in the labour market which is suppressing wages growth. And it may be that the NAIRU is lower than the RBA’s estimate of 5.0% because employee bargaining power is lower.
But the news is not all bad. There are a few tentative signs that wages growth may be about to lift a little.
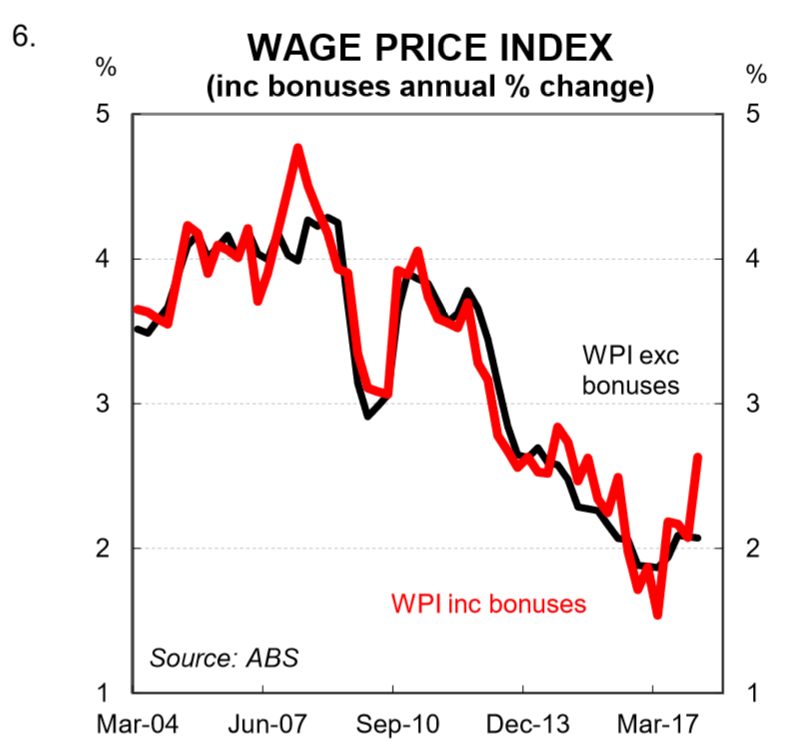
First, the WPI including bonuses rose strongly in Q1 2018 and the annual rate picked up to 2.6% (chart 6). It’s possible that there is just some ‘noise’ in the data and the WPI including bonuses will converge with the WPI excluding bonuses next quarter. But it’s also possible that firms are indeed lifting the pay packets of workers by a bit more than 2.1%pa. Instead of doing it via bigger rises in base pay, however, they have preferred to do it with greater use of discretionary payments like bonuses. We will be looking closing at the Q2 WPI for clarity on this.
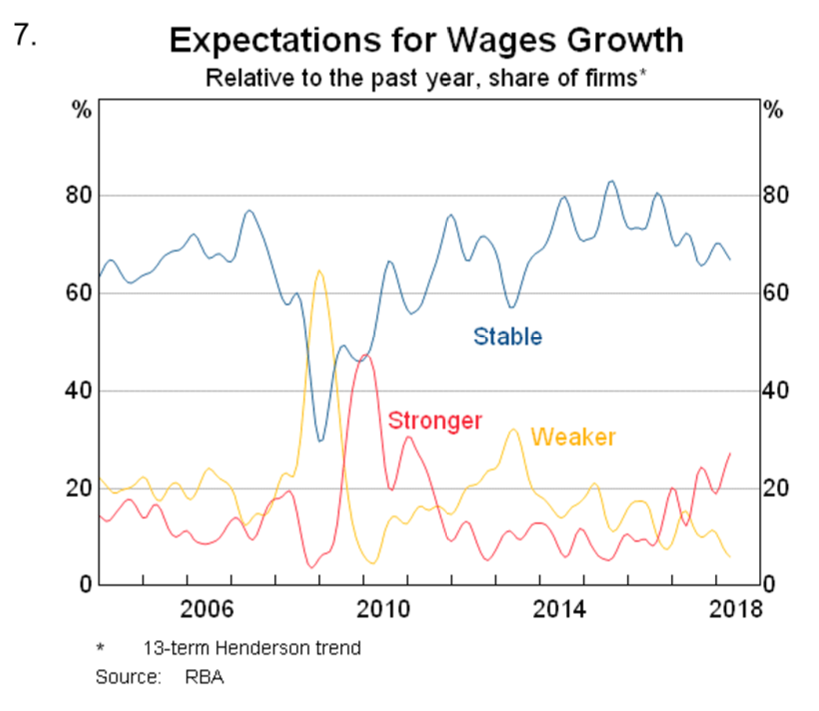
Second, the RBA reports that here are now more firms expecting a pick-up in wages growth and fewer firms expecting a decline compared with recent years (chart 7). Indeed, RBA Governor Lowe appears more assured that wages growth will lift. In June, he noted that, “there are reports that some employers are finding it more difficult to hire workers with the necessary skills.” That comment in his July Statement was bolstered to, “there are increasing reports of skills shortages in some areas”.
From an aggregate household consumption perspective, wages growth must also be looked at in conjunction with the change in the number of people in paid work. The latest data on total employee earnings (i.e the total wages bill) is quite a bit stronger than the pure wage inflation figures because of the solid growth in employment. Compensation of employees rose by 1.2% Q1 2018. And after four decent quarters in a row, the annual rate has risen to 5.1% – its fastest pace since Q2 2012. This is partly why Government revenue has come in stronger than forecast.
(iv) The wealth effect. Changes in asset prices can have an impact on the spending decisions of households via the wealth effect (the notion that changes in demand are influenced by changes in the value of assets). The theory states that when the market value of assets rise, it leads to the feeling of being wealthier which should encourage spending and reduce savings. The theory is also meant to hold in reverse. Namely, that households rein in spending if the market value of assets is falling.
After a little over five years of incredibly strong property price growth, driven by Sydney and Melbourne, dwelling prices have been deflating over the past nine months. At June 2018, prices were down 4.8% in Sydney from their July 2017 peak. Prices in Melbourne were off 2.0% from their peak in November 2017.
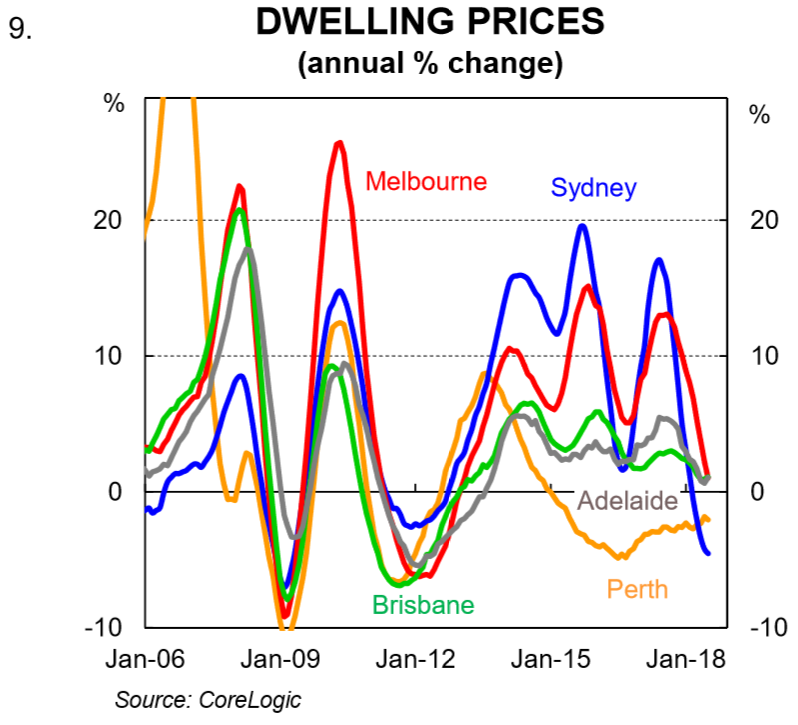
As mentioned previously, despite the fall in dwelling prices, consumer spending growth has picked up over Q2 2018 while sentiment has hit its highest level in almost five years. So there is no evidence yet of a negative wealth effect at play. We suspect the reasons for this are two-fold. First, context is key. Sydney dwelling prices rose by around 75% between early 2012 and mid-2017. Melbourne dwelling prices rose by around 60% over that period. So with that perspective the current deflation has so far been quite mild.
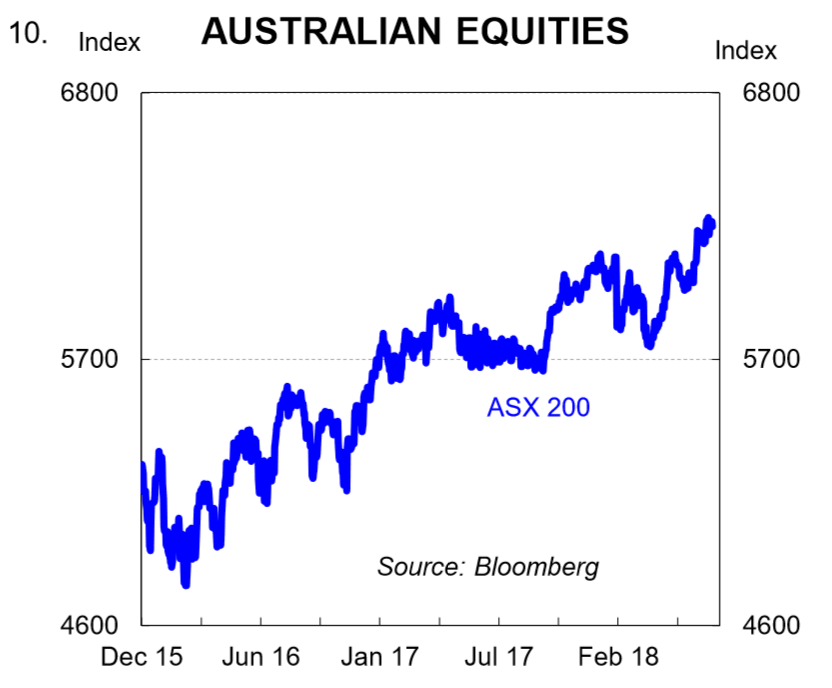
Second, the Australian stock market, as measured by the S&P/ASX 200 index, has risen by 7% over the past three months to a multi-year high. So from a wealth perspective, many households have had the equities component of their balance sheet strengthened. Indeed, movements in equity prices are far more transparent and obvious to households than changes in the notional value of their property.
Looking further ahead, it is our view that dwelling prices will to continue to deflate over the next 1½ years. Credit standards may be further tightened, supply will continue to lift, mortgage rates are more likely to go up than down and buyer price expectations have adjusted downwards from exuberance to more rational levels. We do not expect a hard landing, however. Population growth, driven by net immigration, is expected to remain strong. And rental growth is still positive, which ensures yields look reasonable in a low interest rate world. We also expect the unemployment rate to gradually drift lower, which means that the risk of default is low.
A further softening in dwelling prices would probably have no material negative impact on consumption, as has currently been the case. But there is a risk, of course, that a harder correction in prices (a fall of 10-15%) could weigh on consumer spending via a negative wealth effect. To us, that is a risk, but it is not our central scenario.
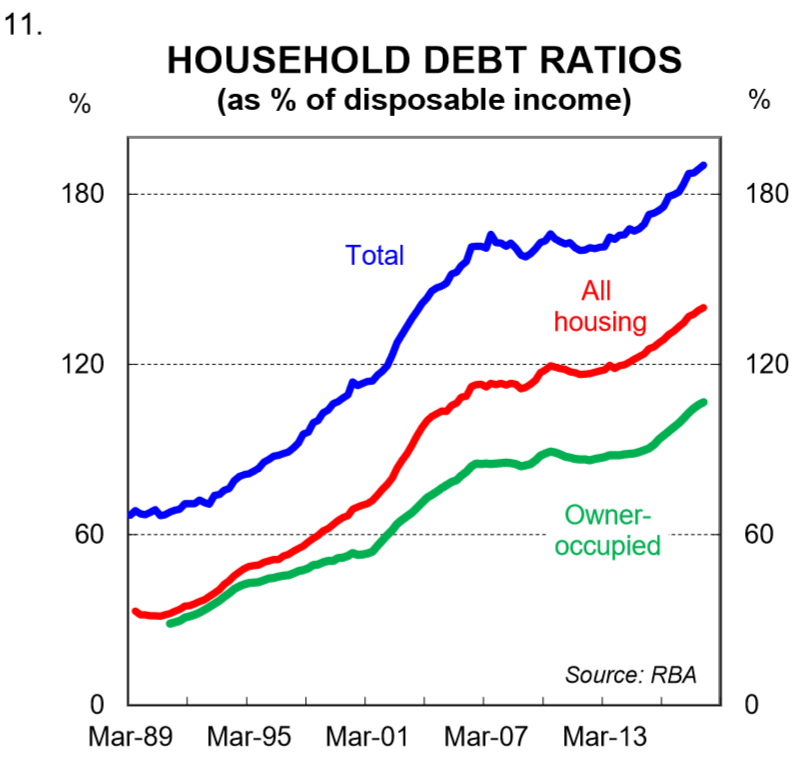
(v) Debt burden: For many households, the number one headwind that they face with respect to consumption is debt repayment. Australia has one of the most indebted household sectors globally. Debt to income ratios have risen from around 148% in mid-2012 to a record high of 190% in Q 2018 (chart 11). This measure includes all households regardless of whether they actually have a mortgage. For households that have a mortgage, that figure is significantly higher. It has increased steadily as interest rates have come down despite lower rates making it easier to repay debt. Basically growth in the net flow of credit (i.e. new credit less repayments) has been higher than growth in income.
A high debt burden relative to income acts as a constraint on future household consumption growth. It means that interest payments as a share of income are higher than otherwise. And of course the principal must be paid too. This leaves households with less income that can be spent on goods and services.
And it means that households have a much greater sensitivity to interest rate changes. From a demographic perspective, it is younger households feeling the debt burden most acutely. There are also about $120bn of interest only loans in aggregate that are scheduled to roll over to principle and interest (P&I) loans annually over the next three years. Borrowers shifting to P&I loans will face higher monthly loan repayments.
The Outlook
There are clearly some green shoots in the data. Consumer spending has lifted in Q2 and households are feeling more confident. The leading indicators of the labour market look good and there are some tentative signs that wages growth may be about to lift. But the backdrop of a highly indebted household sector is here to stay and further falls in dwelling prices appear likely.
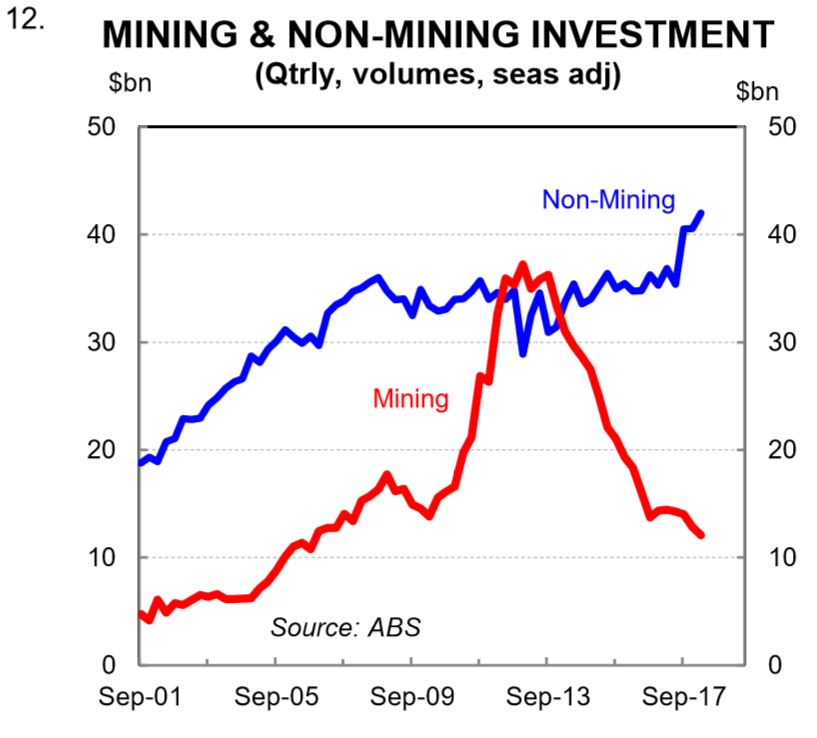
As a result, we expect another year of reasonable household consumption growth in 2018. We have a lift of 2.7% in our forecast profile (the same as 2017). It is worth noting that other parts of the economy have picked up, notably business investment (chart 12). But that isn’t enough to warrant a monetary policy response. We think that monetary policy will stay on hold at least until Q1 2019. Current market pricing ascribes a 30% chance of a hike over the next year.