Friday’s landmark European immigration deal triggered some reversal of recent trends in markets (this morning it appears in doubt). DXY fell as EUR bounced:
EUR longs pulled a bit more but it’s still too over-weight:
Advertisement
AUD took off against DMs:
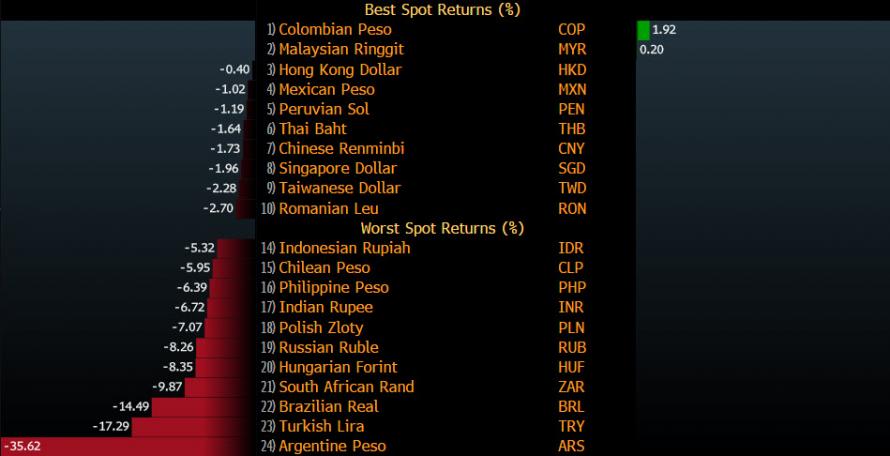
And EMS:
And the CFTC short shrank a touch:
Advertisement
Even the yuan bounced modestly:
Gold too:
Oil powered on:
Advertisement
Base metals were weak in context:
Big miners too:
EM stocks short squeezed higher:
Advertisement
And EM junk:
Treasuries were sold:
Bunds bid:
Advertisement
Italian debt was loved:
And stocks firmed:
As said, the EU immigration compact gave us a little counter-trend rally. US data was solid with a tearaway Chicago PMI and decent PCE growth. Most US Q2 GDP estimates have been trimmed to around 3% plus.
Advertisement
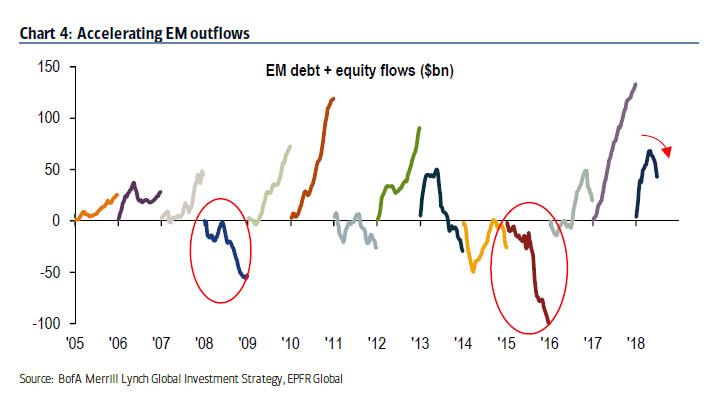
A couple of charts sum up H1 market action. EM to the woodshed:
Advertisement
So, is there any turn in store for H2? The drivers are threefold:
US boom; Fed tightening; big EPS growth; strong assets and rising wages.
China slowing as monetary tightening crimps infrastructure spending.
Europe slowing and struggling with Italy’s radicals plus a sluggish ECB.
Advertisement
These factors mean that the USD is in a bull market owing to better returns across all asset classes. That, in turn, is sucking capital out of EMs and Europe. For H2, MB has long predicted that this will continue as:
the US booms on and USD rises further;
China slows materially and the PBOC faces very difficult choices about how to handle the slowdown, and
Europe flops around between sclerosis and political crisis.
One of MB’s favourite commentators, George Magnus, has it at Bloomie:
Advertisement
“We’ve been here before, the situation is very similar to 2015-2016 when the exchange rate was under pressure” and the PBOC had to spend foreign-exchange reserves to prop it up, he said.
“My worry is that this 20 percent correction in stocks is no reason why you shouldn’t have half as much again. Not that there’s no floor, but we haven’t reached a bottom if the trade situation continues to deteriorate.”
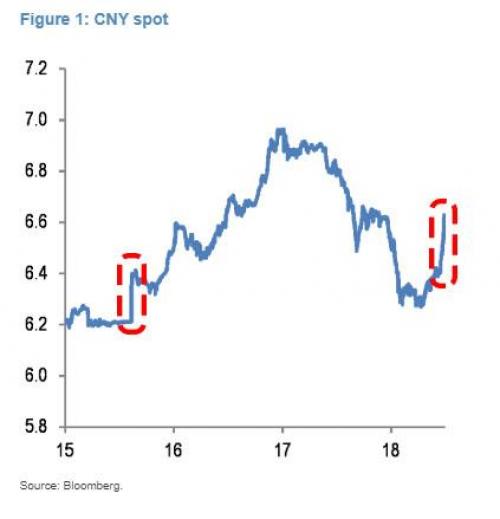
As for the currency, it may depreciate past 7 per dollar over the next year — a level unseen since before officials pegged it for a time during the global financial crisis — as China’s monetary policies continue to diverge from those of the Federal Reserve. The PBOC has shifted gears this year from pursuing concerted financial deleveraging to moving to inject liquidity to support credit growth in the so-called real economy.
Magnus said that though policy makers have eased liquidity recently — including through a targeted reduction of banks’ required-reserves ratio last weekend — ultimately they will need to push on with the deleveraging campaign to reduce financial risks. That’s set to weigh on stocks, though the biggest blow would be a forced tightening to halt a disorderly decline in the yuan, according to Magnus.
The 2015 analogy is good one. JPM sees it as spot on:
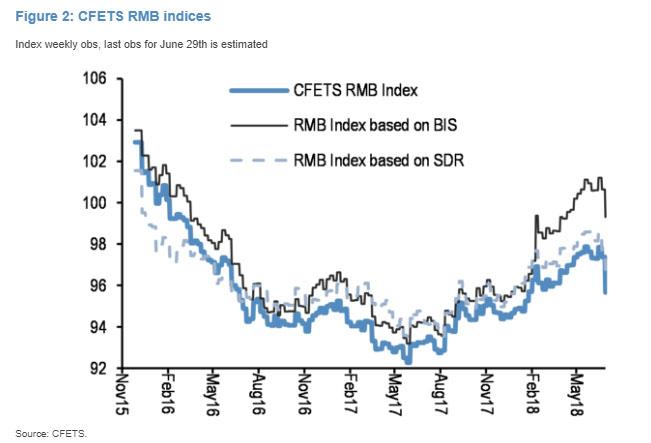
…despite the depreciation over the past two weeks, the pressure on Chinese policy makers to let the Chinese renminbi decline further against the dollar remains given how elevated the CFETS trade-weighted indices are still…this depreciation pressure would increase if trade tensions with the US escalate and the dollar rises further from here.
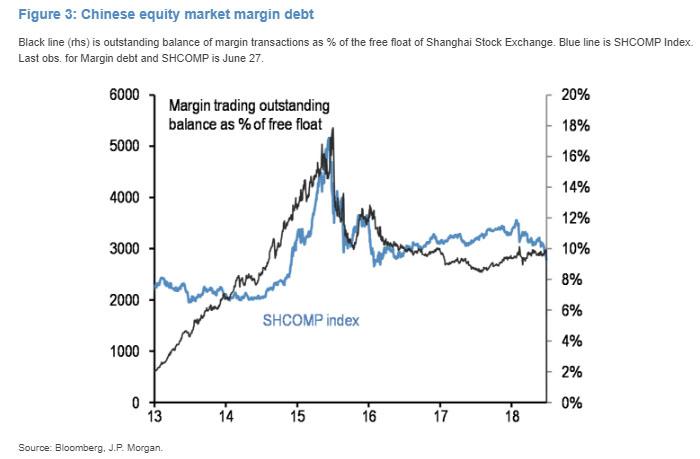
The Chinese equity market is down 13% YTD and is one of the worst-performing markets in the world. During 2015, we had another big correction in Chinese equities as they lost 40% in the summer of 2015. Similar to this year, currency depreciation pressures exacerbated the sell-off at the time.
[Retail margin investors] had fallen sharply during the second half of 2015 after topping at 18% in July of that year. But they stabilized at around 10% of the free float of the Shanghai Stock Exchange since then and are little changed this year.
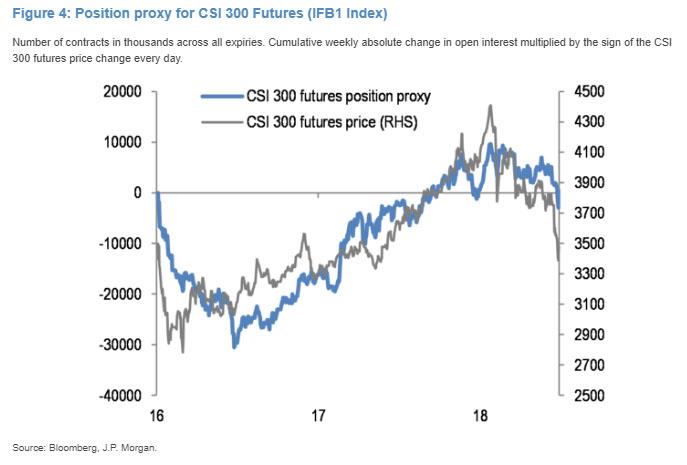
[That implies that this time it is institutions that are selling]. This is consistent with our position proxy for Chinese equities based on CSI 300 index futures shown in Figure 4. This position proxy is based on cumulative daily absolute changes in open interest multiplied by the sign of the CSI 300 futures price change every day. It points to significant reduction in net long positions by futures investors YTD…the decline in this position indicator so far this year has been rather small compared to the position buildup of 2016/2017. The open interest in Chinese equity futures is far from signaling capitulation.
In all, the combination of Chinese equity market declines and currency depreciation pressures revive memories of 2015, and this combination has the potential to unsettle risky markets. Especially if a hawkish Fed or an escalation of trade tensions put further upward pressure on the dollar.
Advertisement
As I noted recently, the Shanghai bourse may be small and marginal as a distributor of capital but it has been a good indicator of incipient Chinese slowdowns.
I am not expecting Chinese growth to drop off a cliff nor for it to stimulate aggressively (2019/20 might be different). It is very difficult for China to ease aggressively while capital flows out strongly and the yuan tumbles. But a steady slowdown is underway and will deepen. That will dent demand from property and infrastructure construction as the year wears on, exacerbated by the same capital withdrawal phenomenon transpiring across EMs.
Importantly, there are two key differences in these macro dynamics from 2015. One is the Trump stimulus and the other the oil price being supported by OPEC. These two ensure that US growth and inflation will remain stronger this year than was the case during the 2015 China slowdown. In that year the major channel of contagion was the crashing oil price that smashed US junk spreads and equities plus wages, forcing the Fed to pause its tightening in early 2016. That enabled China to hit the gas without crashing the yuan further. This combination is referred to by some as the “Shanghai Accord”. No such luck this time.
Advertisement
That leads me to conclude that the story of the next six months is falling commodity prices as weakening EM demand combines with with a strengthening monetary headwind in the USD, and both hit hard up against epic commodity inventories.
That spells the end of the AUD as bulk commodities fall even as the the negative yield spread keeps deepening:
Advertisement
70 cents by year end. Lower next year.
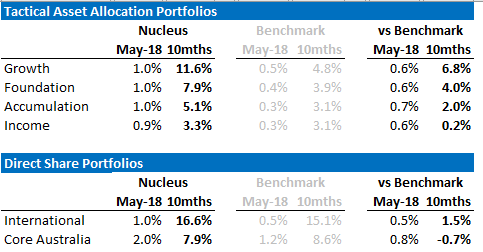
David Llewellyn-Smith is the chief strategist at the MB Fund which is over-weight global equities that benefit from a weaker AUD. The first option is to use the MB Fund International Stocks Portfolio which is always 100% long as a part of your own asset allocation mix. The second option is to use an MB Fund tactical allocation in which we choose the asset mix for you, including exclusively international stocks, but with bonds and other assets as well to ensure a more conservative mix.
The recent performance of both is below:
Advertisement
If these themes interest you then contact us below.
Advertisement
The information on this blog contains general information and does not take into account your personal objectives, financial situation or needs. Past performance is not an indication of future performance.
David Llewellyn-Smith is Chief Strategist at the MB Fund and MB Super. David is the founding publisher and editor of MacroBusiness and was the founding publisher and global economy editor of The Diplomat, the Asia Pacific's leading geo-politics and economics portal.
He is also a former gold trader and economic commentator at The Sydney Morning Herald, The Age, the ABC and Business Spectator. He is the co-author of The Great Crash of 2008 with Ross Garnaut and was the editor of the second Garnaut Climate Change Review.


this depreciation pressure would increase if trade tensions with the US escalate and the dollar rises further from here.