DXY was slammed then rebounded last night as EUR and CNY were firm:
The Australian dollar jumped then slumped against DMs:
And EMs:
Advertisement
Gold was firm:
Oil too:
Base metals were mixed:
Advertisement
Big miners to the moon:
EM stocks as well:
Junk not so much:
Advertisement
Treasuries were sold:
Bunds too:
Italian debt is awesome:
Advertisement
Stocks want to break out:
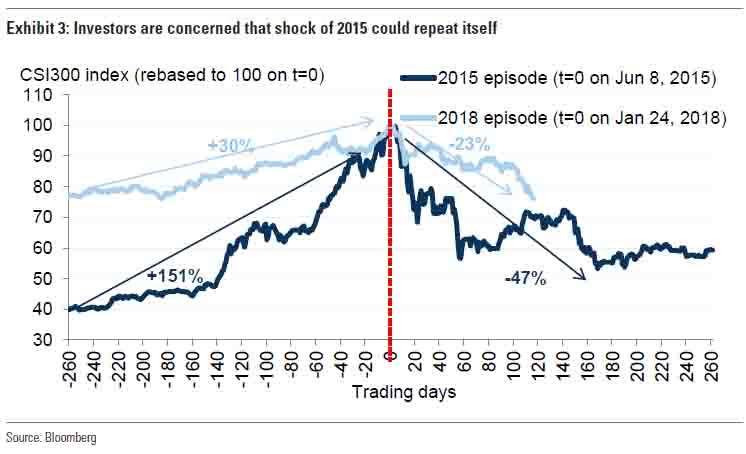
To my mind this is a classic bear market snap-back in the EM and commodity complex following Goldilocks US jobs. US growth leadership is intact. European growth has reset lower. And China is slowing. Nothing has changed despite some efforts to put lippy on the slowing Chinese pig, via Goldman:
…external headwinds seem more challenging now, characterized by strained Sino-US (trade) relations and the resulting Rmb volatility, solid but moderating global growth, a tightening Fed, and EM assets weakness.
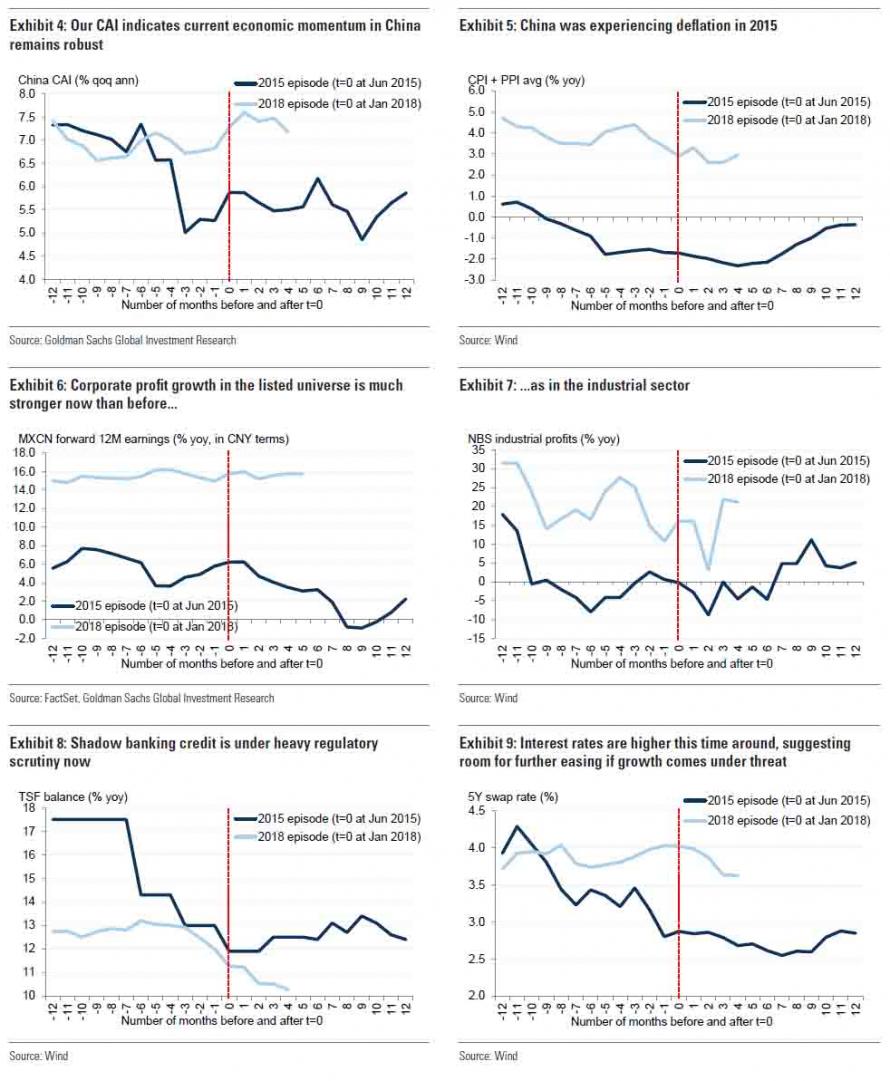
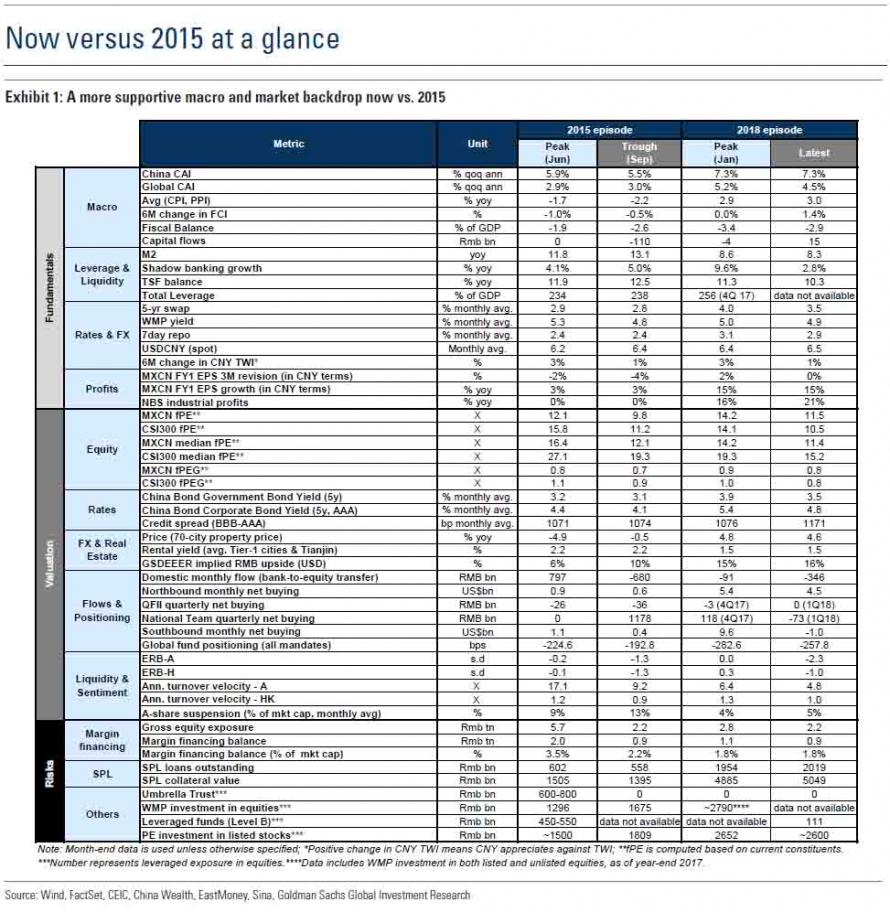
In 1H15, the Chinese economy was still suffering from deflation (average of CPI and PPI: -1.7% yoy) stemming from overcapacity issues domestically and lackluster global demand, as measured by our China and Global Current Activity Indicators (CAI). As a result, corporate earnings were lackluster, with NBS industrial profits and aggregate earnings of the listed universe growing merely 0.7% and 10%, respectively, in the first half of the year.
But in the current episode, we view the fundamental picture a lot more promising: Our China CAI has been growing on average 7.0% yoy in the first 5 months of the year, NBS industrial profits were up 17% yoy during the same period, and “New China” industries are still delivering impressive growth so far this year on our proprietary measure. In the equity market, corporate earnings were solid in 1Q, expanding 15% yoy. Forward-looking indicators also remain encouraging, with consensus earnings being revised up 0.4% since end-March and our top-down earnings model, which takes into account PMI and inflation proxies, pointing towards a strong 2Q.
Growth aside, the macro/policy environments also differ in the following aspects:
Credit growth was markedly stronger in 2015 as the authorities were embarking on a major credit easing cycle to combat deflation and support growth (particularly after the market boom/bust) while in more recent times “deleveraging” and “controlling financial risk” are the key policy objectives that have been heavily emphasized by policymakers since the 19th Party Congress in October last year. The policy commitment is somewhat reflected in the downtrend in M2, the shadow banking component in TSF, and our economists’ total money growth proxy since the beginning of the year;
Monetary conditions were generally more accommodative in 1H15 based on our China Financial Condition Index (GS China FCI). In particular, price of money was easier back then (lower 7-day repo and swap rates), suggesting room for monetary policy easing in the current episode if growth comes under threat
Different starting points: China A shares had an impressive run from 2H14 to 1H15, rallying 65% and 151% 6m and 12m before the peak in June 2015. At its peak, China A shares had total market cap of US$11tn (US$308bn ADVT for June 2015), representing 107% of 2014 GDP, and 41% of US market cap at the time. From Jan 2017 to Jan 2018, while China A shares delivered 26% returns, it was underperforming its DM and EM peers.
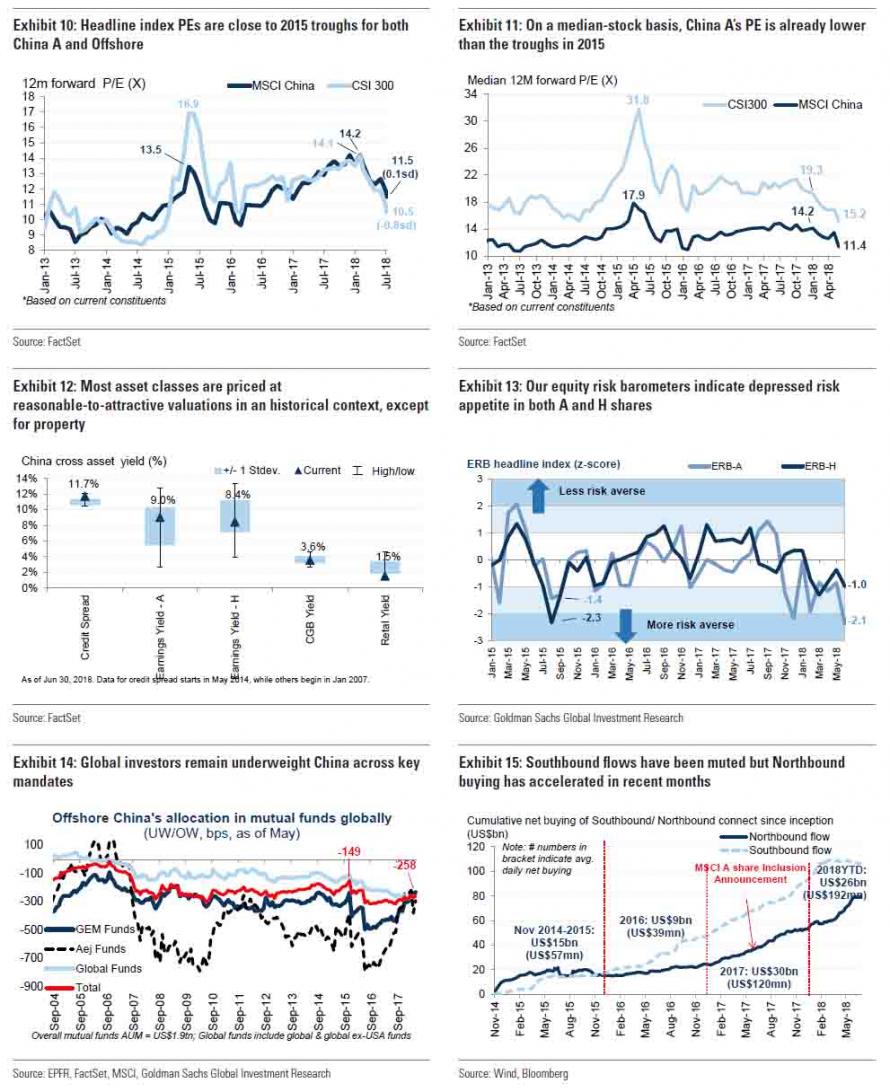
Equity valuations look more supportive now. Headline index P/E peaked at 17x in June 2015, but at only 14x in Jan 2018 (now at 10.5x), with the average/median PEs showing even larger gaps (median PE at 15x now vs 32x in 2015). The PEG ratios tell a similar narrative, hovering at 1.0x now vs. 1.3x then, suggesting corporate earnings growth is generally more attractively priced than 3 years ago.
Our equity risk barometer (ERB) for China A, which we view as a comprehensive sentiment indicator, which encompasses 16 discrete variables such as turnover velocity, market volatility, and cross-asset correlations, suggests that risk appetite wasn’t even at extreme levels at the onset of the drawdown (ie, it was in neutral territory in early Jan) but is currently at very depressed levels not seen since the GFC meltdown a decade ago.
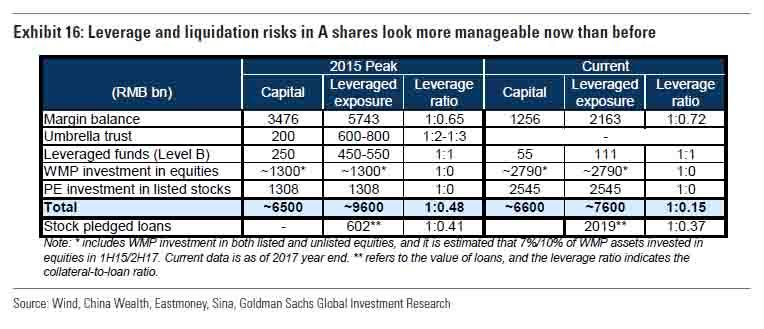
Overall, we’d argue that the current systemwide leverage ratio (1:0.15) is substantially lower than the peak in 2015 (1:0.5), although market risk may have shifted towards redemption this time around, from margin-unwinding back in 2015, due to the crackdown on the shadow banking credits. Official margin loan balance has more than halved from the peak in June 2015 (Rmb2.3tn) to Rmb0.9tn now. Margin financing balance accounted for 3.5% of listed market cap in June 2015, but is only at 1.6% at present. Importantly, the effective leverage offered by this channel has been quite measured (and tightly regulated), at around 1 to 0.7 (i.e. $70 of loans on $100 of capital), with still-healthy guarantee ratios of around 240% as of June. We estimate that equity prices would need to fall another 26% from current levels to trigger margin call for the average margin financing positions.
Brokers’ margin financing aside, investors are concerned about other leveraged exposures which are not captured in the brokers channel, notably leveraged funds and wealth management products (WMP). Aggregating our bottom-up and our banks team’s estimates, we see these vehicles combining to Rmb2.8tn worth of equity holdings, representing 5% of listed A-share market cap. However, our understanding is that, unlike those investing in the bond market, most of the equity-oriented WMPs are unlevered and hence they are more likely subject to redemption risk than margin call risk.
Stock pledged loans (SPL) have been one of the key topical concerns among investors in the context of forced selling in A shares. In sum, we see limited liquidation (and systemic) risk in this area, because: (1) the outstanding value of pledged shares and loans is Rmb5.0tn and Rmb2.0tn respectively, 10% and 4% of A-share listed market cap; (2) Loan-to-value (LTV) ratios are generally fairly conservative for SPL (37% on average over the past 3 years); (3) We estimate that only 31% of the outstanding pledged shares/loans are facing margin call risk, representing 3%/1% of market cap; (4) it would require another 20% fall in equity prices to push the margin call risk to 50% of total; and (5) According to Bloomberg, window guidance from regulatory bodies has been issued to brokers to reduce the risk of unordered liquidation, even when a margin call is triggered.
Other OTC leverage products: “Hidden” OTC leverage was perhaps the reason why the correction in 2015 was manifested in such a fast and furious fashion. These OTC products were not tightly regulated and some of them were able to offer as high as 10X leverage to investors (e.g. P2P financing), thereby amplifying the up and down moves of the 2015 boom/bust cycle. At their peak, these products in aggregate could add another Rmb1tn-Rmb1.5tn levered exposure on top of brokers’ margin financing. At the moment, highly-levered OTC products still exist (e.g. P2P financing and online financing platforms) but their scale is likely to be a fraction of that in 2015, based on our channel checks.
As such, while we maintain our positive (Overweight) stance on Chinese stocks, we would take a selective implementation approach to better navigate the near-term volatility…investors will remain jittery over China stocks until there is greater clarity about resolution to ongoing heightened trade tension, and/or more pronounced policy responses in terms of policy loosening, FX stabilization, and perhaps less likely, marginal relaxation of financial regulation tightening.
Advertisement
Honestly, Goldman should stop employing rocket scientists to do macroeconomics. Talk about over-analysis to prove a point in the rear vision mirror.
Slowing Chinese credit may be good for financial stability long term but it is not bullish for growth or commodities now, I’m afraid. Nor is Donald Trump launching a trade war on its huge surplus. Nor is plodding European growth.
Readers will know that my own bearishness on China has been quite muted this year. I expect a slow slowing as credit tightening bites. However, as Trump and the Fed tighten the noose on China’s external accounts you’d have to be barmy to not see the risk of a steeper slowdown rising. 2015 be damned.
Advertisement
China’s monetary loosening to date has been nowhere near enough to turn this around. That’s part of the issue. It can’t loosen owing to the external pressures which threaten the yuan. That point will come but we’re not there yet and that means more slowing ahead, lower commodity prices yet, and more pressure on the AUD.
David Llewellyn-Smith is Chief Strategist at the MB Fund and MB Super. David is the founding publisher and editor of MacroBusiness and was the founding publisher and global economy editor of The Diplomat, the Asia Pacific’s leading geo-politics and economics portal.
He is also a former gold trader and economic commentator at The Sydney Morning Herald, The Age, the ABC and Business Spectator. He is the co-author of The Great Crash of 2008 with Ross Garnaut and was the editor of the second Garnaut Climate Change Review.