
The March quarter Business Indicators report, released yesterday, includes aggregate wages & salaries data, which according to the ABS measures “gross earnings before taxation and other deductions” and “includes provisions for employee entitlements”.
In order to get a better sense of how this data is tracking, I have deflated these aggregate nominal figures to real values (using the consumer price index) and real per capita values (using the latest population data).
Below are the charts presented in index form since the series’ inception in March 2001.
First, the national picture:
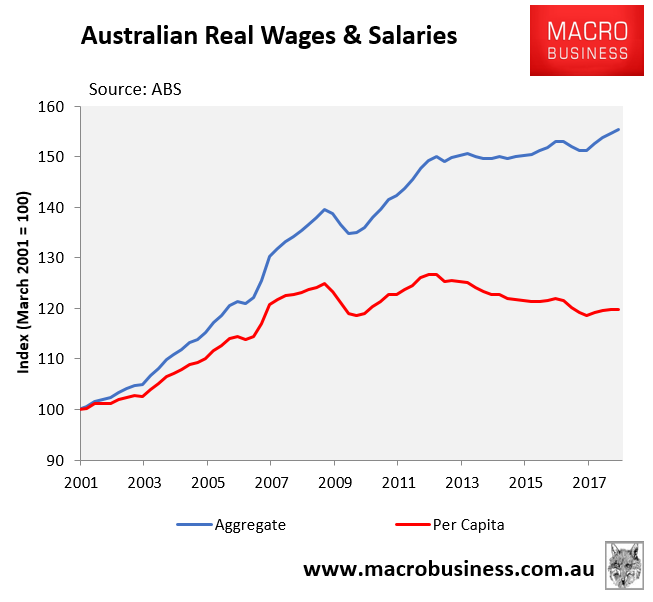
In the year to March 2018, per capita real wages & salaries rose by 1.1% in trend terms. However, over the decade they still fell by 2.6%.
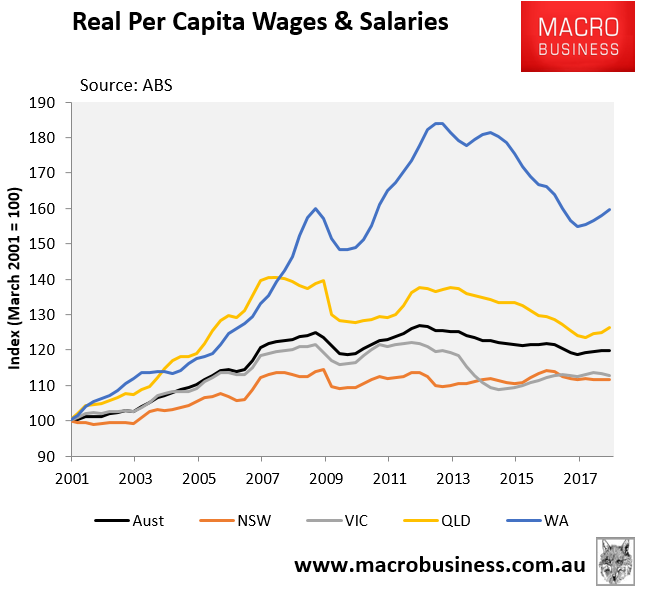
Next, New South Wales:
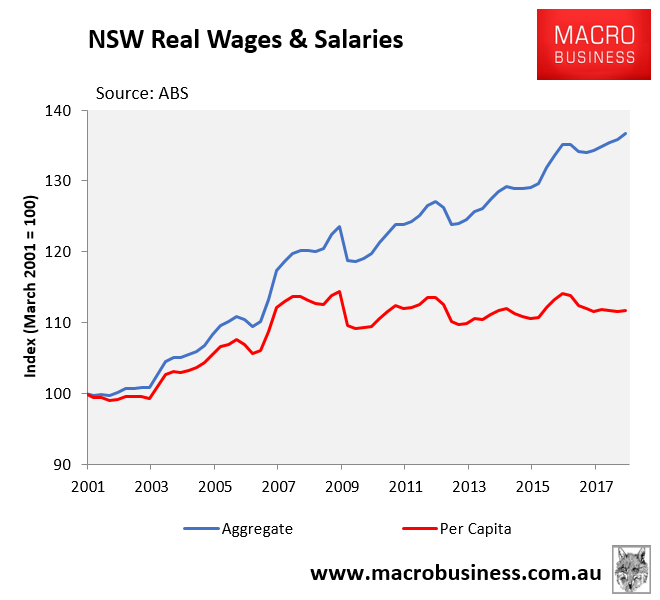
Per capita real wages & salaries rose by 0.2% in the year to March 2018 in trend terms but were 1.1% lower over the decade.
Next, Victoria:
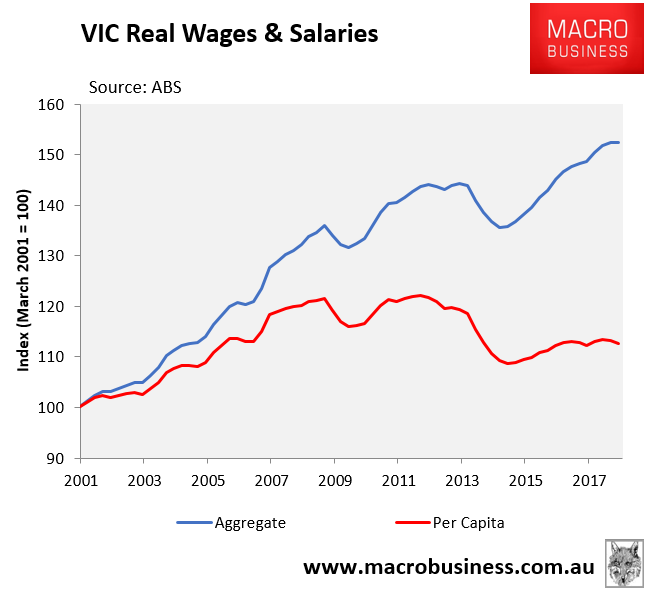
Per capita real wages & salaries rose by 0.3% in the year to March 2018. However, they were 6.1% lower over the decade.
Next Queensland:
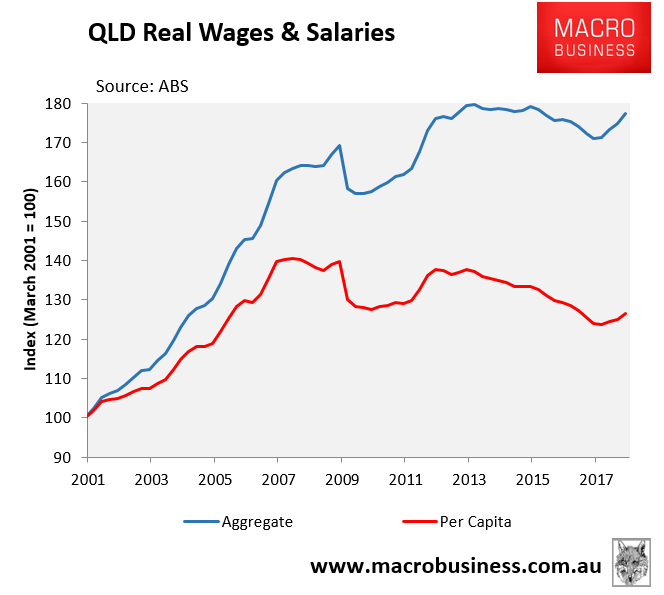
Per capita real wages & salaries rose by 2.0% in the year to March 2018 but were 9.3% lower over the decade.
Next Western Australia:
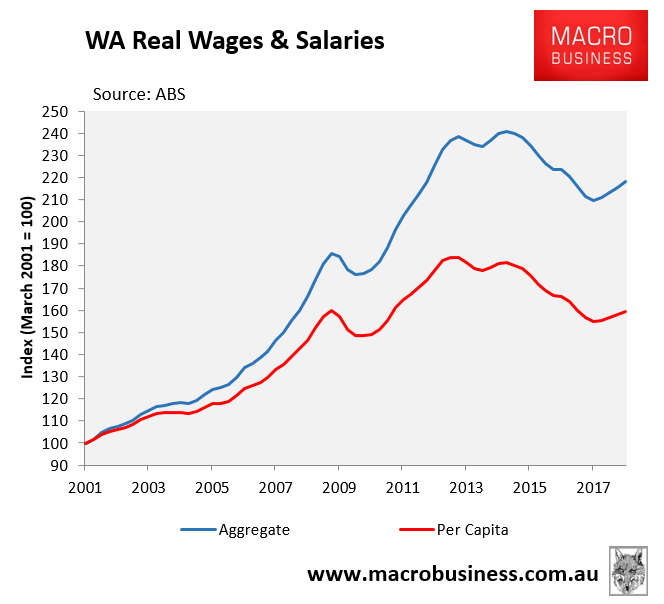
Per capita real wages & salaries rose by 3.1% in the year to March 2018 and were 9.0% higher over the decade.
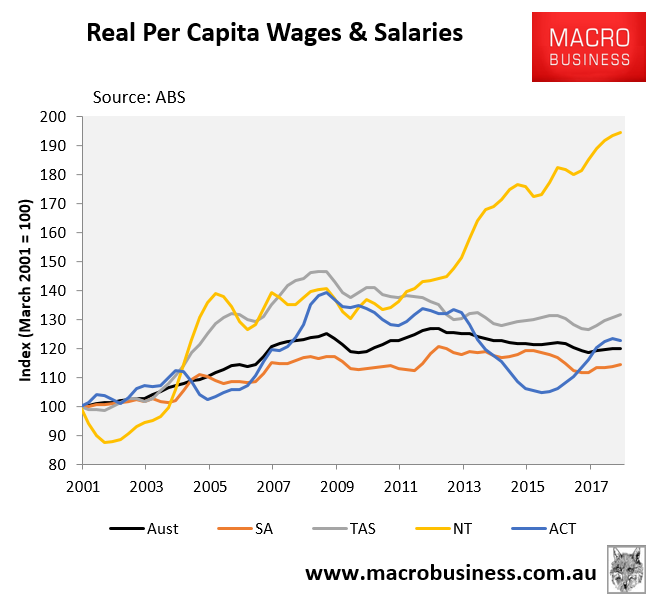
Next South Australia:
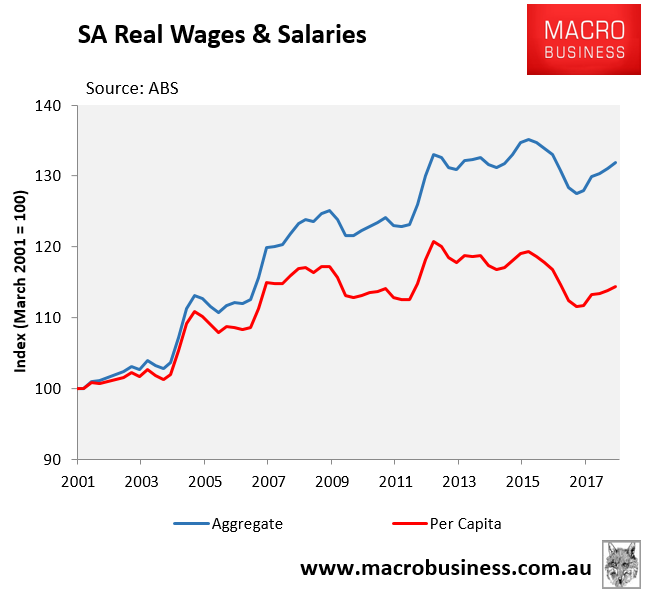
Per capita real wages & salaries rose by 2.4% in the year to March 2018 but were 2.2% lower over the decade.
Next Tasmania:
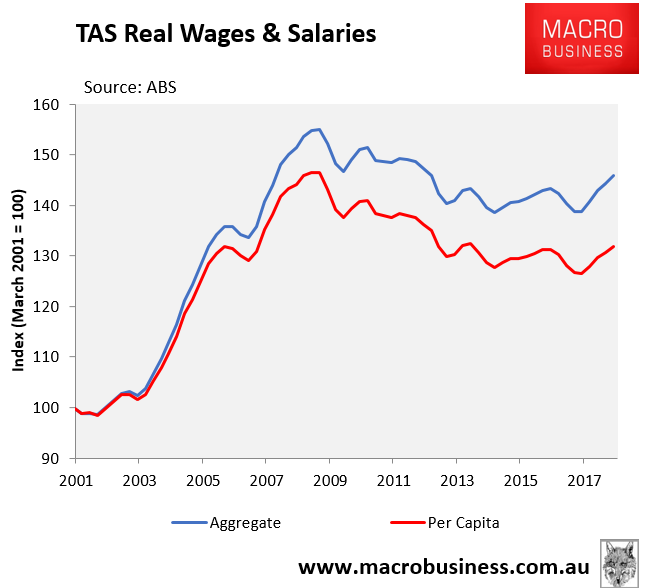
Per capita real wages & salaries rose by 4.2% in the year to March 2018 but were 8.5% lower over the decade.
Next the ACT:
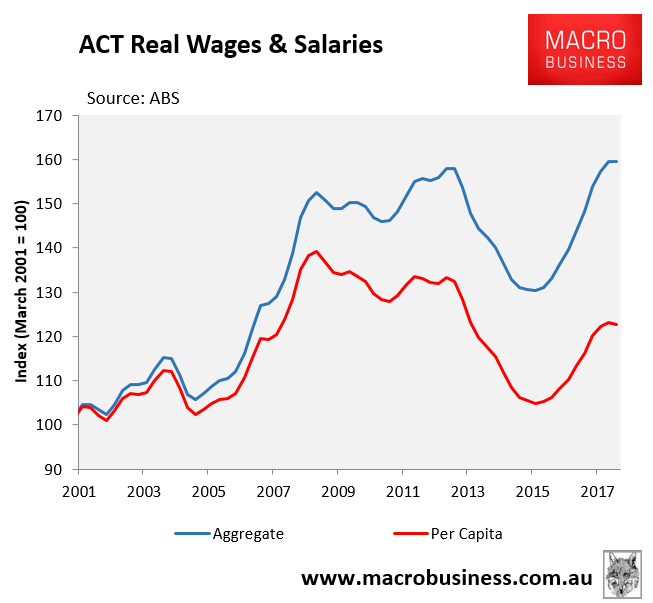
Per capita real wages & salaries rose by 5.6% in the year to March 2018 but were 4.5% lower over the decade.
And to round things out, here’s the NT:
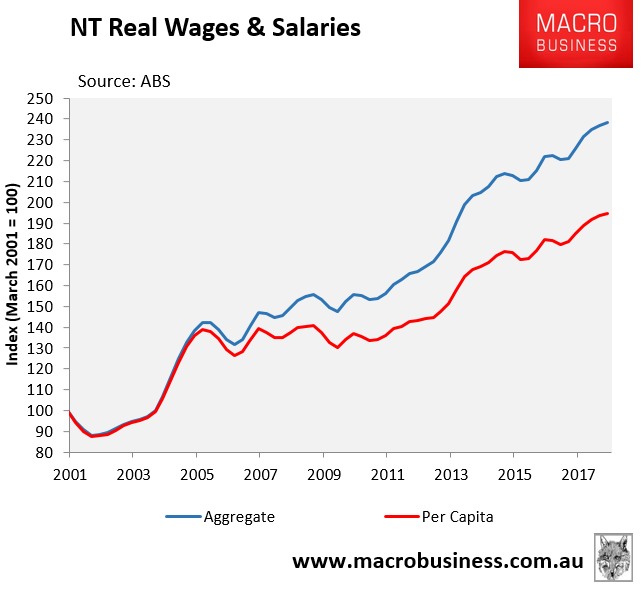
Per capita real wages & salaries rose by 5.1% in the year to March 2018 and were 41.2% higher over the decade.
Finally, here’s the per capita summary by jurisdiction:
It should be emphasised that the above charts measure real aggregate wages & salaries on a per capita basis (i.e. divided by every man women and child), rather than on an per employee basis, so it does not take into consideration changes in the employment-to-population ratio (this fell from 62.8% in March 2008 to 62.0% in March 2018).
Nevertheless, the above charts suggest that Australian workers’ living standards have been falling for a decade, masked on an aggregate level – and caused in part by – breakneck population growth (immigration). However, at least there has been some improvement over the past year.
unconventionaleconomist@hotmail.com
