I’m still trying to be nice but it’s getting harder. The post-Domainfax Michael Pascoe has red-lined on houses being cheap:
This won’t go down well with the housing crisis brigade, but housing affordability has not gone through the roof. It’s actually been fairly stable for the past quarter century
And to the extent that housing affordability has worsened recently, it’s renters rather than owners who have felt the pain.
Further heresy? That darling of the housing shock chorus, “housing stress” (the go-to for scary headline clickbait) has also been relatively stable for buyers, but increasingly bad for renters.
The trick in the above is that it considers housing costs as a percentage of disposable income, not just housing prices in isolation. Yes, prices have jumped, but over the quarter century interest rates have plunged and incomes have risen.
They are the key findings in a report by Ben Phillips, associate professor at the Australian National University’s Centre for Social Research and Methods.
Dr Phillips’ methodology exposes the flaky nature of most housing affordability stories that consider price movements only as a ratio of average wages. And, like plenty of serious but often under-reported studies over the years, it highlights the plight of lower-income renters as the people with the real housing crisis.
As Dr Phillips’s report in The Conversation acknowledges, the median Australian house price has soared from $140,000 in December 1997 to $540,000 last December, a compounding annual increase of 7 per cent and a 68 per cent increase compared with disposable income.
But those two decades of rising housing prices haven’t done much to housing affordability. The real problem period was the decade to 1993.
“This was a combination of weak income growth and strong increases in housing costs, particularly mortgages with interest rates increasing sharply over this period,” Dr Phillips writes.
“Since peaking in 1993 costs remained relatively stable with rents increasing modestly over the past 10 years, while mortgage costs declined.
“Overall, actual housing costs relative to income have remained stable since 1993 at around 16 per cent of disposable income.”
Sorry, Gen Y and Z, we Boomers haven’t been fibbing when we told you we had it harder.
In recent times I have witnessed excuses about today’s record high house prices (and record low affordability) that do not pass the laugh test and warrant thorough debunking.
The first is the claim that when mortgage rates halve, this means that a buyer can afford to purchase and pay-off a home twice the price.
This claim is easily debunked by the below stylised example.
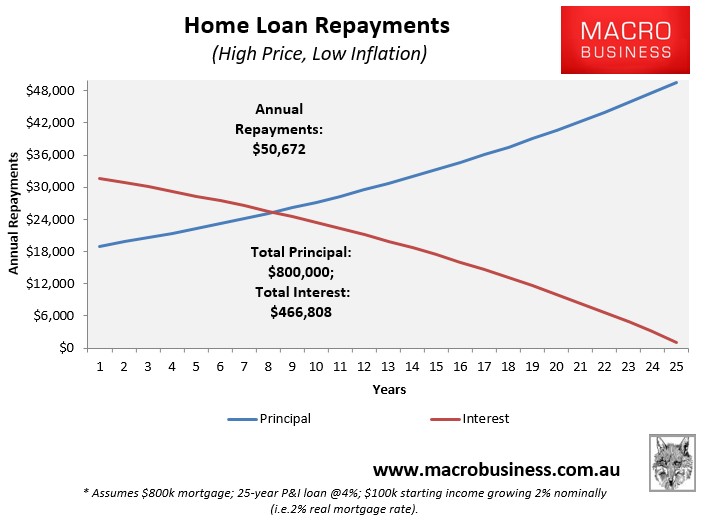
Scenario A (high price, low inflation):
Buyer has an annual income of $100,000.
They buy a house valued at $800,000 (assume no deposit).
The mortgage rate is 4%, which remains the same throughout the 25 year loan-term.
Inflation is very low and wages grow at 2% annually (i.e. 2% real mortgage rate).
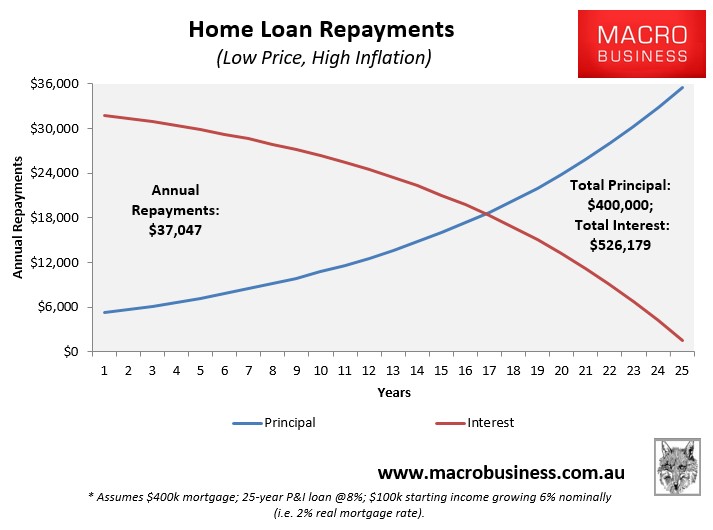
Scenario B (low price, high inflation):
Buyer has an annual income of $100,000.
They buy a house valued at $400,000 (assume no deposit).
The mortgage rate is 8%, which remains the same throughout the 25 year loan-term.
Inflation is high and wages grow at 6% annually (i.e. 2% real mortgage rate).
The below charts show the repayment schedules for both mortgages:
As shown above, a buyer under scenario A ends up with a far higher repayment burden. Why? Because while their initial interest repayment is the same, they are required to repay an extra $400,000 in loan principal over the 25 year term. Hence, halving the mortgage rate does not justify a doubling of home prices.
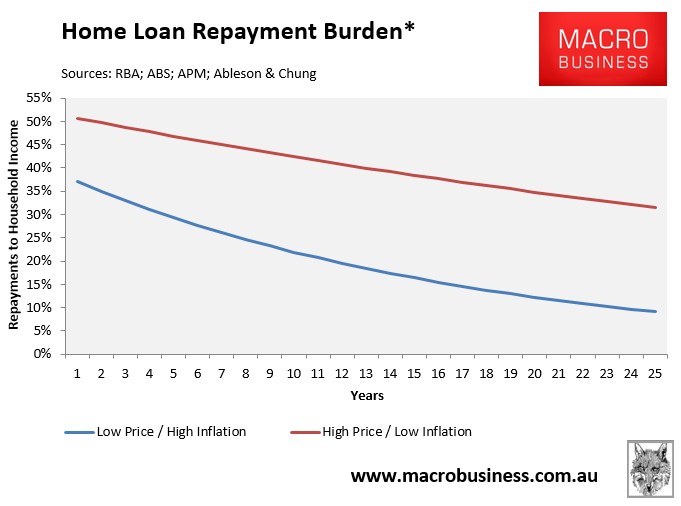
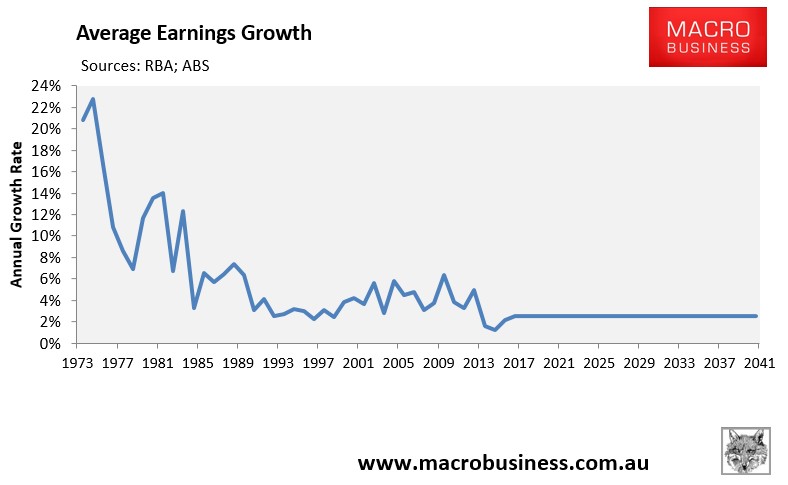
The situation is even worse when wages growth is taken into account. Periods of high inflation are generally accompanied by high nominal wages growth. And while both scenarios above assume the same real wages growth (2%), the high inflation buyer enjoys much faster nominal wages growth, which effectively inflates away their mortgage balance over time (see next chart).
After 15 years, Buyer A’s mortgage repayment burden has reduced by only 24% (to 38% of income), whereas for Buyer B it has reduced by 56% (to 16%).
In the final year of the loan, Buyer A’s mortgage repayment burden has reduced by only 38% (to 32%), whereas for Buyer B it has reduced by 75% (to 9%).
In short, low inflation and low nominal wages growth means that a big mortgage taken-out today remains a big mortgage for decades to come.
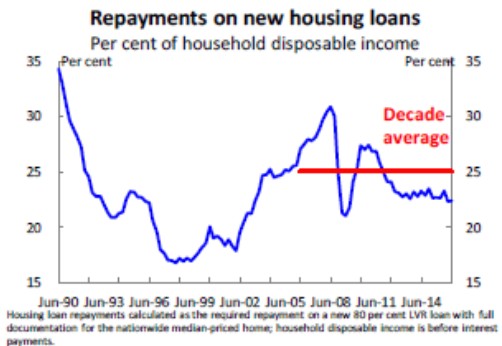
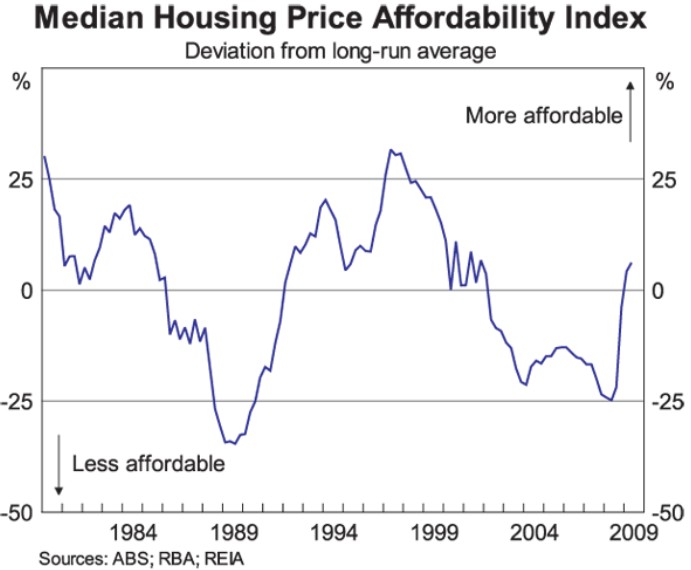
The second claim that I often hear is that mortgage rates hit 17% in 1989-90, which made housing affordability much worse for the baby boomer generation. In Scott Morrison’s latest housing speech he claimed as much, including the below chart showing that today’s mortgage repayments are way below 1989-90:
The RBA has previously made similar claims:
The inherent problem with these types of affordability measures is that they only gauge initial housing payments on new mortgages at the particular moment in time, and not repayments over the full 25 to 30 year loan term.
To highlight why this is nonsensical, consider the below extreme stylised example.
Scenario A (very low price, very high inflation, extreme mortgage rate):
Buyer has an annual income of $100,000.
They buy a house valued at $300,000, (assume no deposit).
The mortgage rate is 17%, which remains the same throughout the 25 year loan-term.
Inflation is very high and wages grow at 7% annually (i.e. 10% real mortgage rate).
Scenario B (high price, very low inflation, very low mortgage rate):
Has an annual income of $100,000.
They buy a house valued at $700,000 (assume no deposit).
The mortgage rate is 3.5%, which remains the same throughout the 25 year loan-term.
Inflation is low and wages grow at 2% annually (i.e. 1.5% real mortgage rate).
In case you haven’t noticed, Scenario A is a proxy for the late-1980s home buyer, whereas Scenario B is a proxy for today’s home buyer.
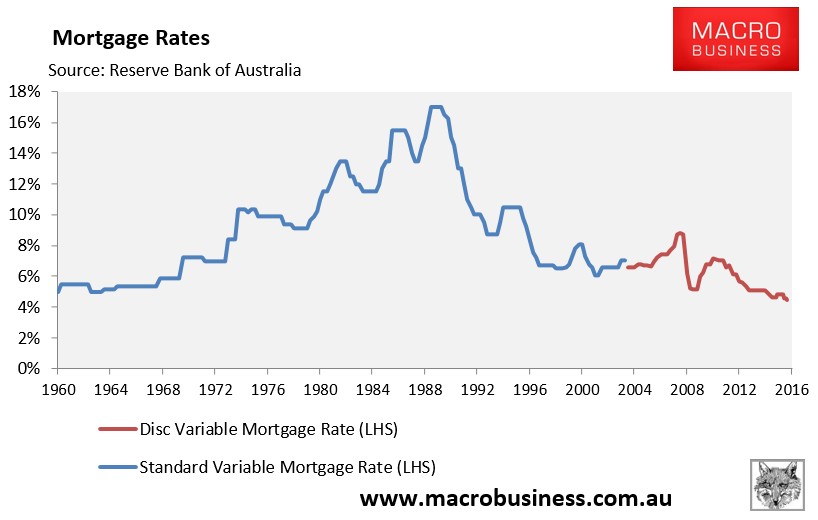
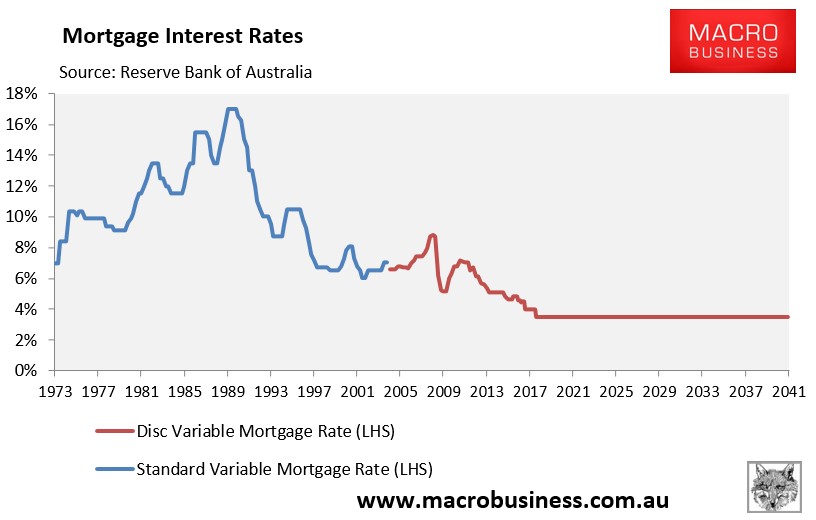
It should be noted at the outset that while mortgage rates briefly hit 17% in 1989-90, they did not stay there for long. They have also never been as low as the 3.5% assumed above (see next chart).
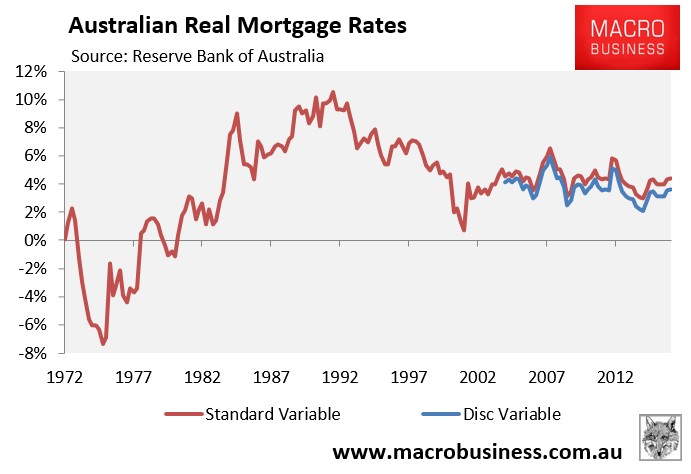
Similarly, real mortgage rates were only 10% briefly throughout the late-1980s and early 1990s (see next chart).
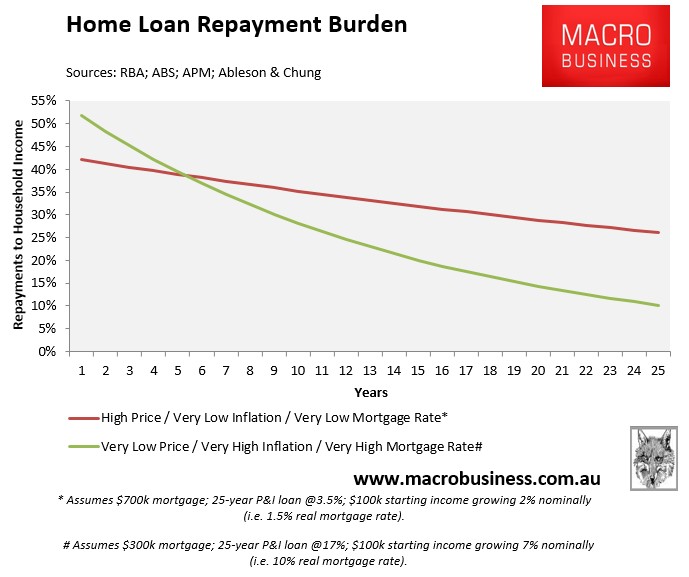
Nevertheless, even in the extreme example above, the buyer in Scenario A only pays more in mortgage repayments for the first six years (see next chart).
Thanks to the wonders of high nominal inflation and wages growth (and even in the face of a 10% real mortgage rate), Buyer A’s mortgage debt is inflated away quickly such that their mortgage repayments are:
28% of income after 10 years;
20% of income after 15 years;
14% of income after 20 years; and
10% of income in the final year.
Buyer B is not nearly as lucky, since their repayment burden remains high in the face of low inflation and wages growth, even though they face a ridiculously low real mortgage rate of just 1.5%. Buyer B’s mortgage repayments are:
35% of income after 10 years;
32% of income after 15 years;
29% of income after 20 years; and
26% of income in the final year.
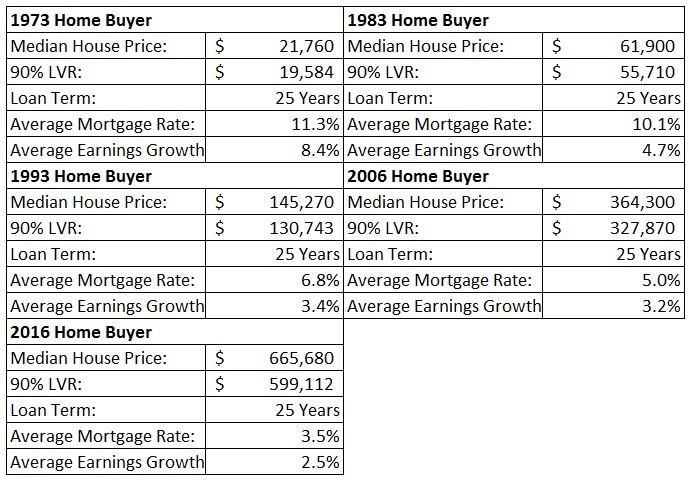
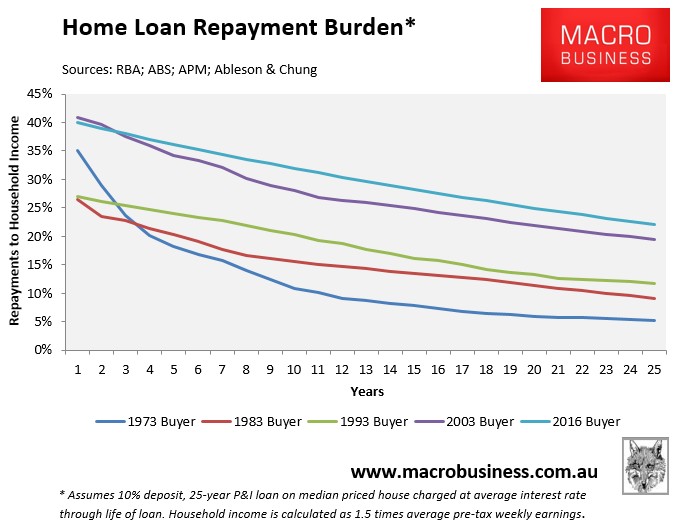
Coincidentally, today’s home buyer also faces the worst mortgage repayment burden in recorded history. The below table compares the mortgage repayments facing a 2016 buyer of a median priced house against those of the median 1973, 1983, 1993, and 2003 buyer using actual historical data:
Note that I have used very generous assumptions for the 2016 buyer including a rebound in earnings growth from recent historical lows:
As well as assuming that mortgage rates crater at 3.5% next year and stay there for the entire life of the loan:
Even with these generous assumptions, today’s home buyer is facing a much more difficult loan repayment schedule than at any other time in living history due largely to the combination of high home prices, low inflation and low income growth:
For this reason, beyond all others, commonly used measures of housing affordability – which only consider the size of the initial mortgage repayment on a brand new loan at a particular point in time – should be junked. They massively understate the affordability pressures facing contemporary home buyers.
David Llewellyn-Smith is Chief Strategist at the MB Fund and MB Super. David is the founding publisher and editor of MacroBusiness and was the founding publisher and global economy editor of The Diplomat, the Asia Pacific's leading geo-politics and economics portal.
He is also a former gold trader and economic commentator at The Sydney Morning Herald, The Age, the ABC and Business Spectator. He is the co-author of The Great Crash of 2008 with Ross Garnaut and was the editor of the second Garnaut Climate Change Review.